
It's also a question of trust
Chris asks:
Hi Greg, Can I post a question here related to trust - trusting the price action on crosses? As I underatand it the price for a cross (say GBPAUD) is calculated as follows: price GBPUSD / price AUDUSD. Therefore, the price action for GBPAUD does not directly reflect transactions that involve the exchange of GBP for AUD and vice versa, Whereas the price for GBPUSD is more directly relfection of supply and demand, and transactions for that pair. Consequently I find it difficult to trust support and resistance levels for crosses as it seems less likely that if traders start selling GBPAUD at the 60-200ma (for instance) that this will directly impact price action for this cross, given how the price is calculated. I wonder if I have adopted a flawed assumption here about trading crossses, something that is preventing me from trusting support/resistance levels and divergences. Am I missing something or have I got something wrong?
Chris...you bring up valid points.
Yes the GBPAUD is has as parents the GBPUSD and the AUDUSD. The price of each go into making up the GBPAUD. Since I can presume that the GBPUSD and AUDUSD have greater depth of market, traders may trade the technicals of each of those pairs, and the GBPAUD goes in those pairs washing machine to be rinsed, and spun and rinsed and spun again. There should be no rhythm (PS I will never spell "rhythm" right the first time. Thank you spell check) or reason to the technicals.
I make a leap of faith. My faith is based on the idea that at the end of any peak or valley in any market that is liquid - that can be charted - there is a person(s) like you or me who is focused on one thing....RISK. And these person(s), make a pretty good buck because they are the best (by the way, it is not me).
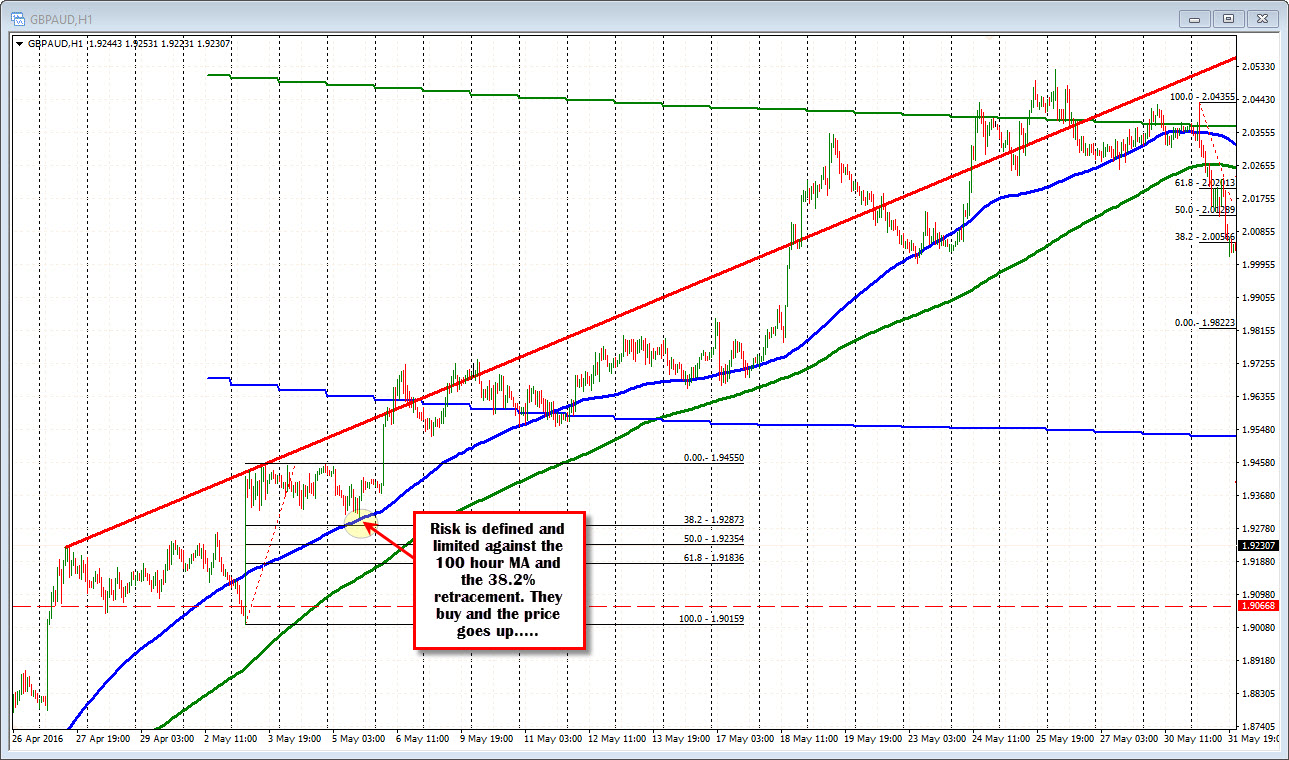
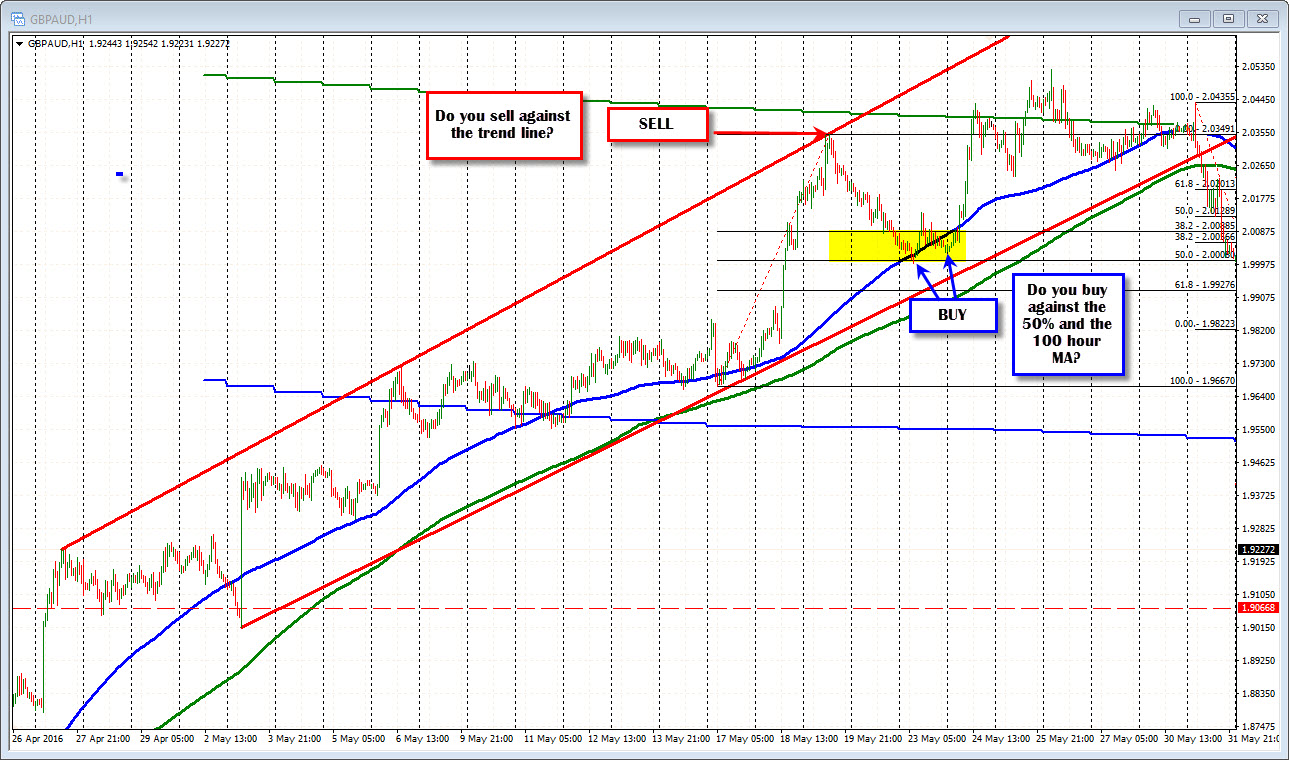
They look at charts and they see things like trend lines, Fibos and MAs. Sometimes what they see, works great.... (see GBPAUD chart below). The price holds the 100 and 38.2% and the price goes higher.... If they were wrong, they get out below that 100 hour MA and book a loss.
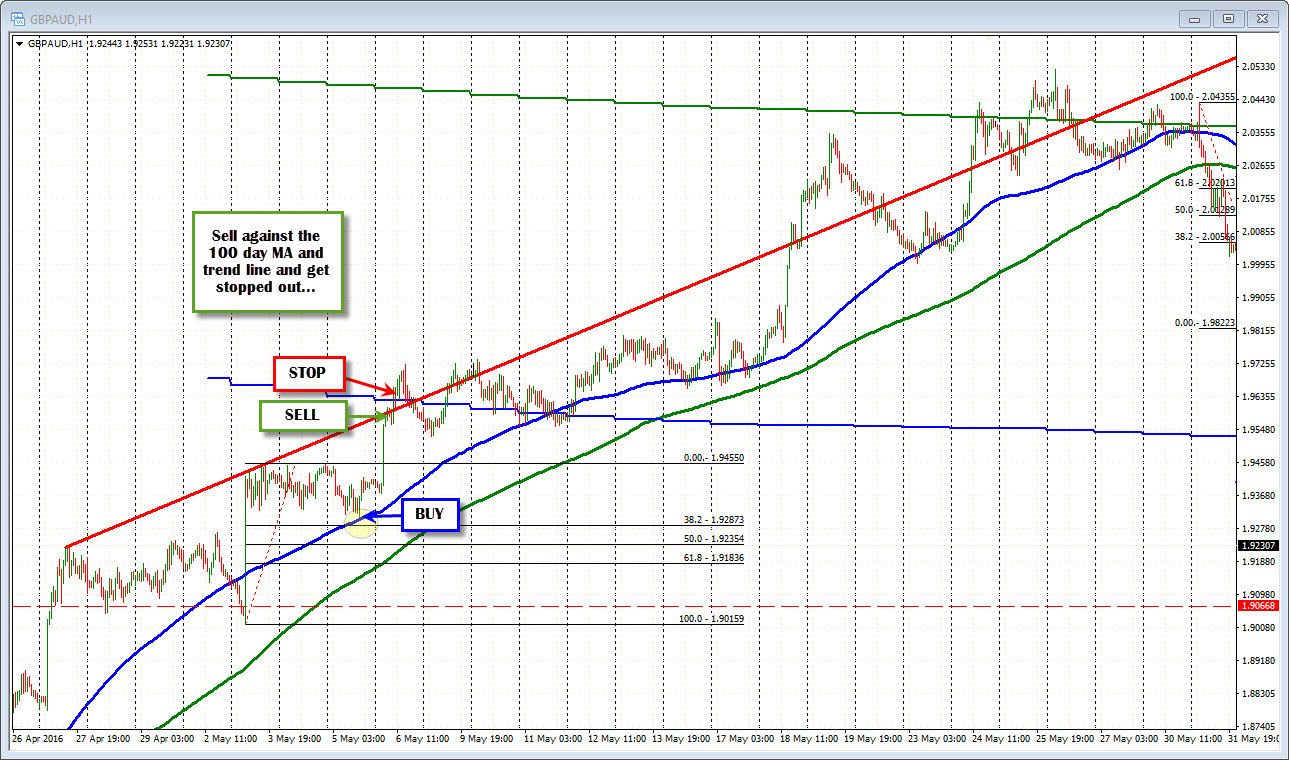
Other times they may sell against the 100 day MA (see chart below and the topside trend line and get stopped out....(hopefully they were long from down below and were just taking profit though).
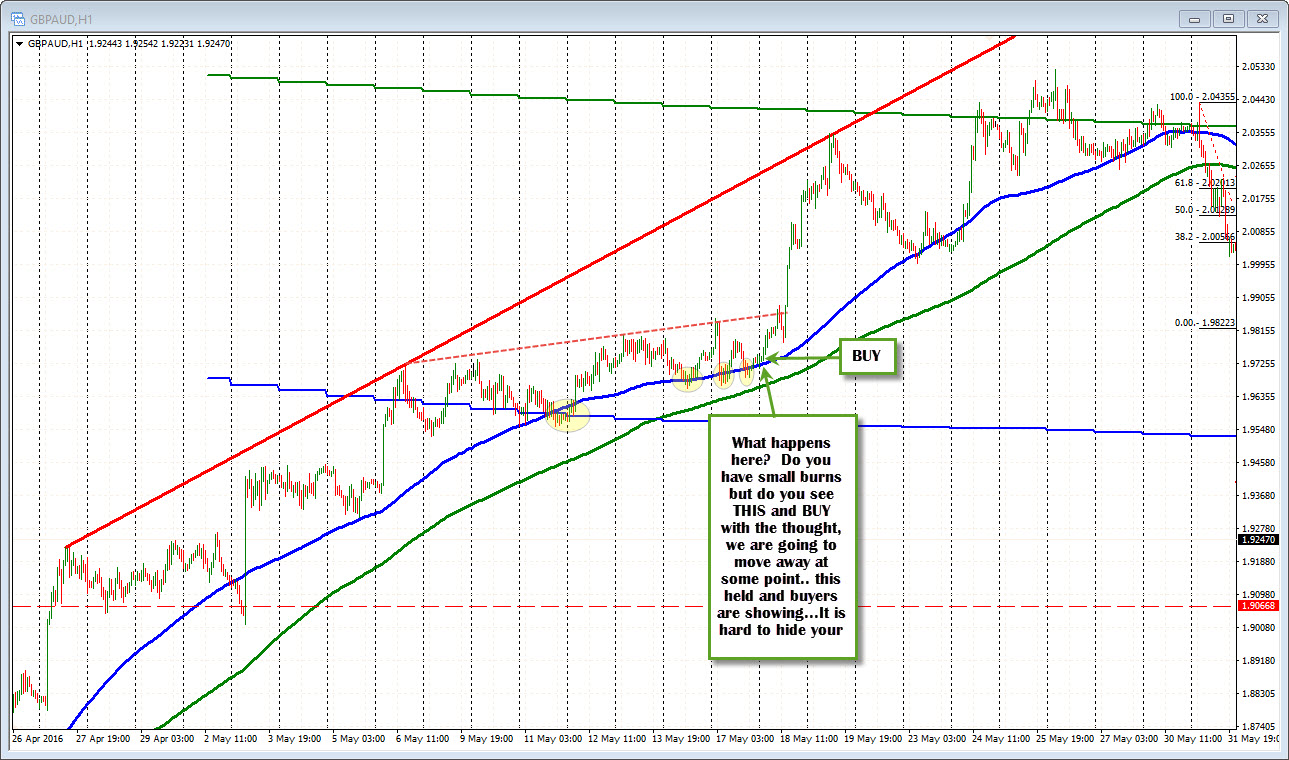
When the price comes down to the 100 hour MA on the chart below and goes below then back above, goes below and back up, goes below and back up but finds sellers above too. Does that person(s) stick with the idea and buy the last test - where the price moves above and holds the line and then takes off. Did you see that trade?
When it gets up to the topside trend line, does the person(s) lean against the trend line and have it hold. Then go back down to the 100 hour MA (see chart below).....
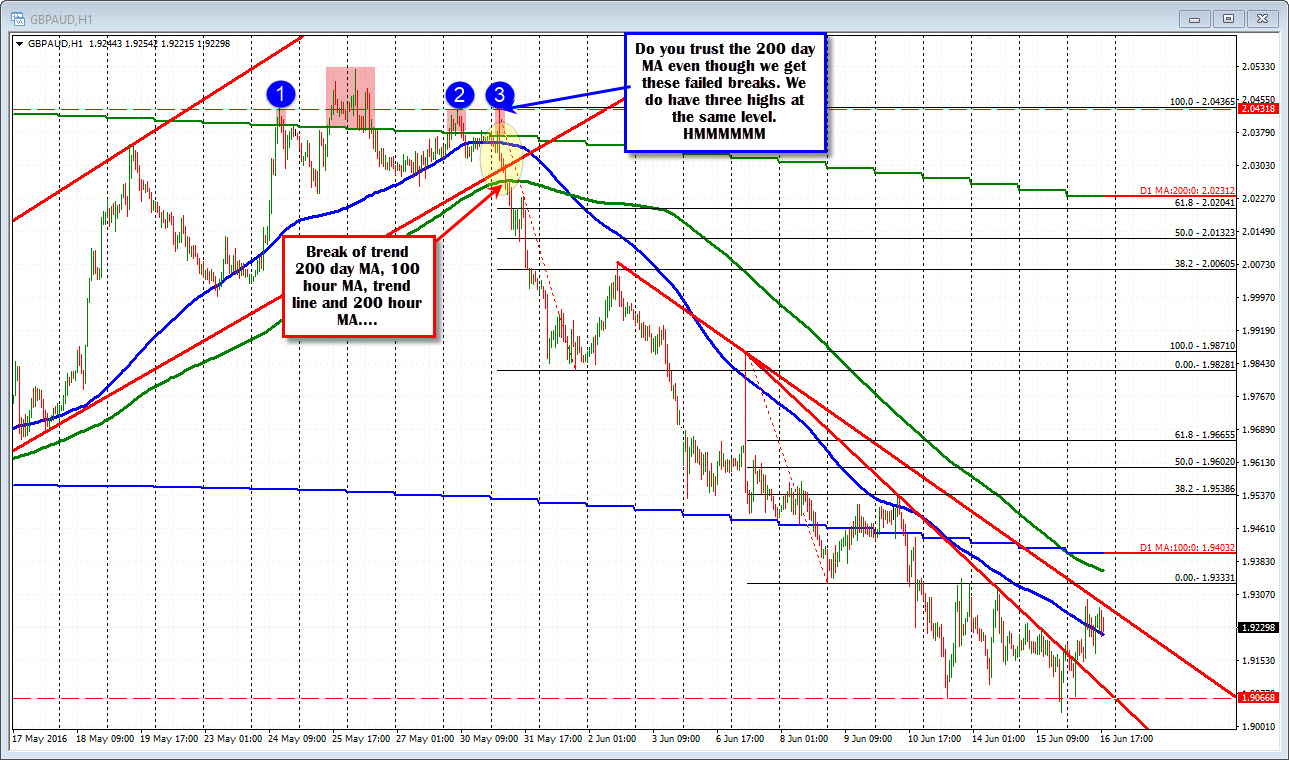
At the top, do you trust what you see at the 200 day MA (see chart below). There are failed breaks but there are 3 highs that stall at the same level. On the break lower day, the 200 day MA is broken, the 100 hour MA, the trend line, and the 200 hour MA are all broken on the same day... BEARISH clue???
Following the GBPAUD down further does the person(s) lean against other levels. I can see many times....
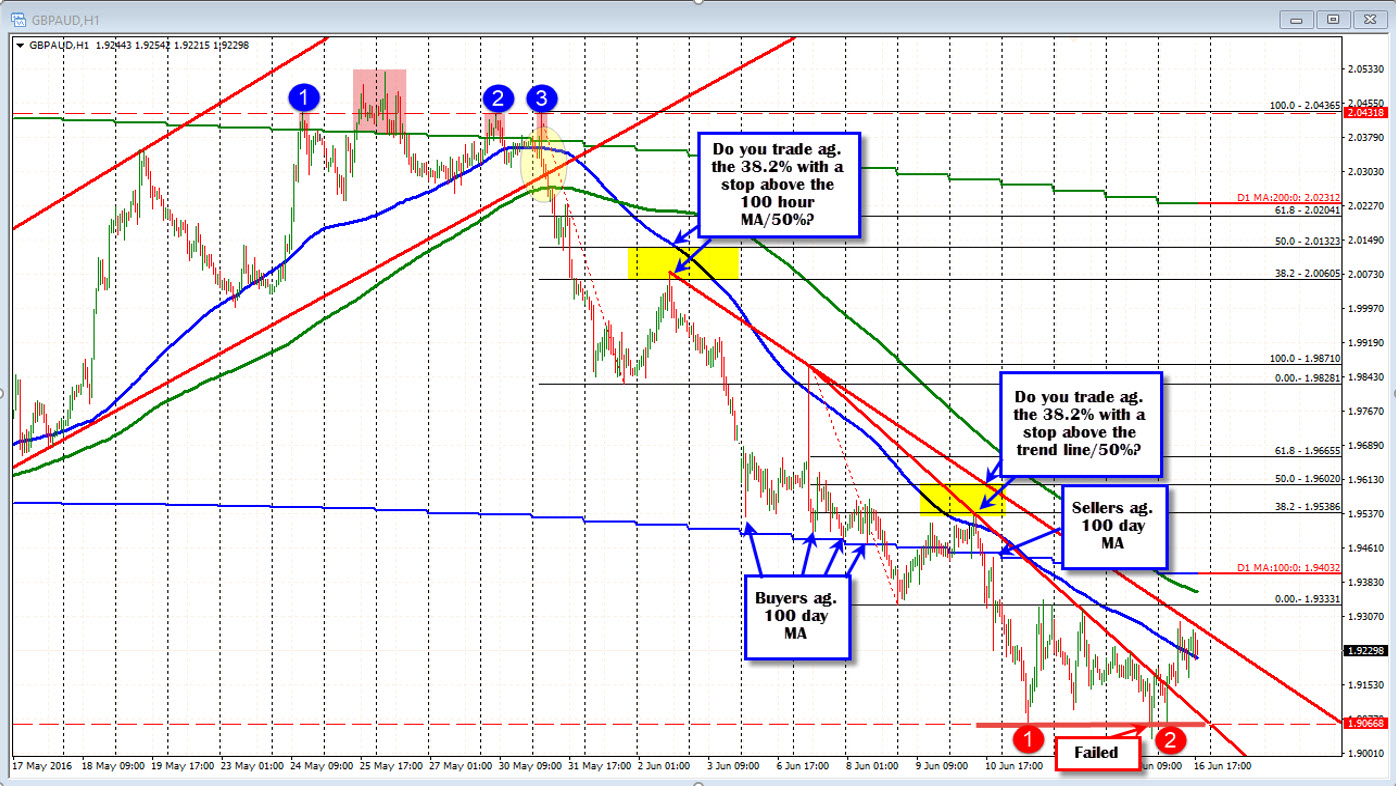
Chris.... You have to believe in something. I know and hear what you say and it makes sense, but rock, paper, scissors the people who stop the price against a trend line, who stop the price against a 100 day MA, who stop the price at the 38.2% ahead of the 100 hour MA and/or the trend line....All those people are focused on risk. They are not focused on GBPUSD or AUDUSD. That is what I believe!

