
Plenty of chop in the pair
The GBPJPY is certainly not the friendliness of pairs from a trending perspective. Looking at the 4-hour chart below, there is a lot of chop in between some pretty wide trend lines. If you are to trade this pair, you need to accept the volatility.
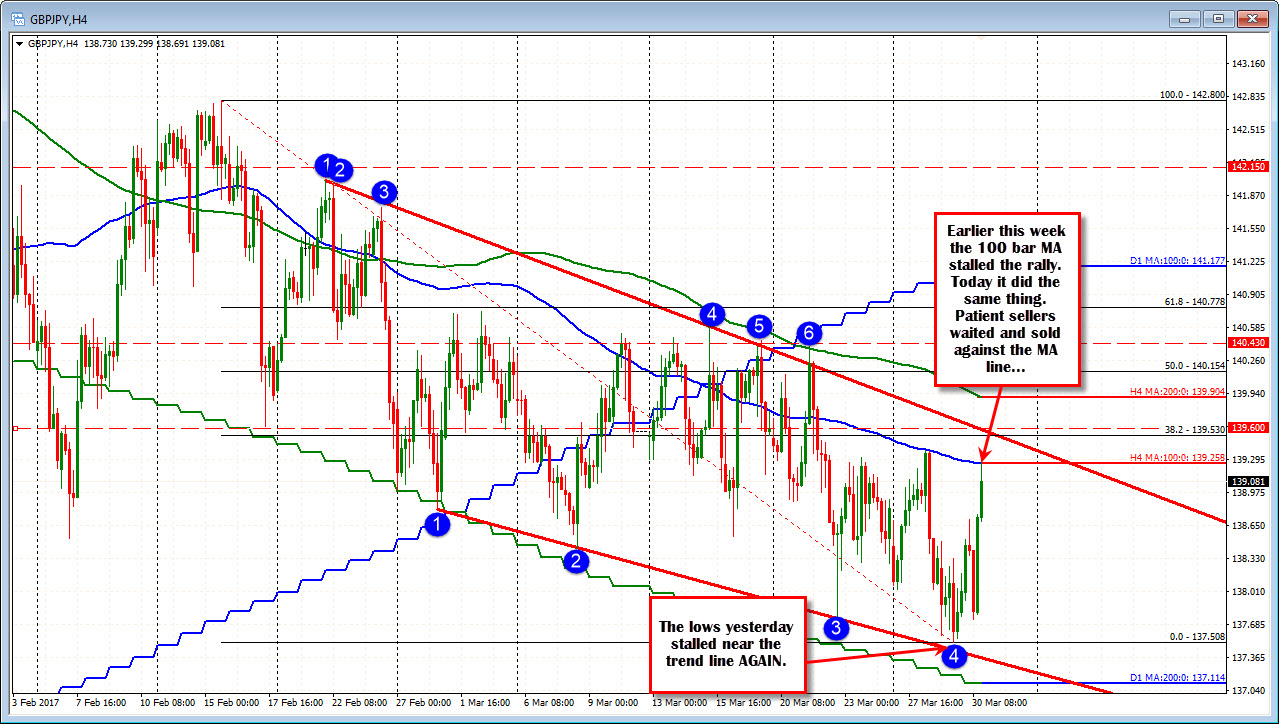
From this 4-hour perspective, what seems to be a good strategy is to wait for the extremes.
What might they be?
Well moving from right to left (not counting today's spike), the high spike from earlier this week stalled at the 100 bar MA on Tuesday (blue line currently at 139.258). When that line was tested, sellers leaned and the price moved lower.
There is another extreme off this chart that sellers could look toward. That is the trend line that cuts across currently at around 139.60. The 38.2% of the move down from the Feb 15th high comes in at 139.53 not far from that line.
So from this chart and longer term perspective, patient sellers could wait for the:
- 100 bar MA on the 4-hour chart at 139.258 or
- Even more patient sellers could wait for a test of the 139.53-60 area.
I would not waste a lot of pips if trading around those levels. The goal is to sell an extreme and hope "the market" does too - forcing the price back down.
What about on the downside?
Well, the trend line connecting most recent lows has 4 points on the line (see the lower trend line on the chart above). Last week and again this week, the low has stalled at - or just ahead - of that trend line level.
Like on the topside, I would not waste a lot of pips trading around that trend line. The goal is to buy an extreme and hope "the market" does too - forcing the price higher.
Can you trade in between those extremes?
If I were, I want to see some technical patterns in and around technical levels. I will also look to see more of the intraday price action for those clues.
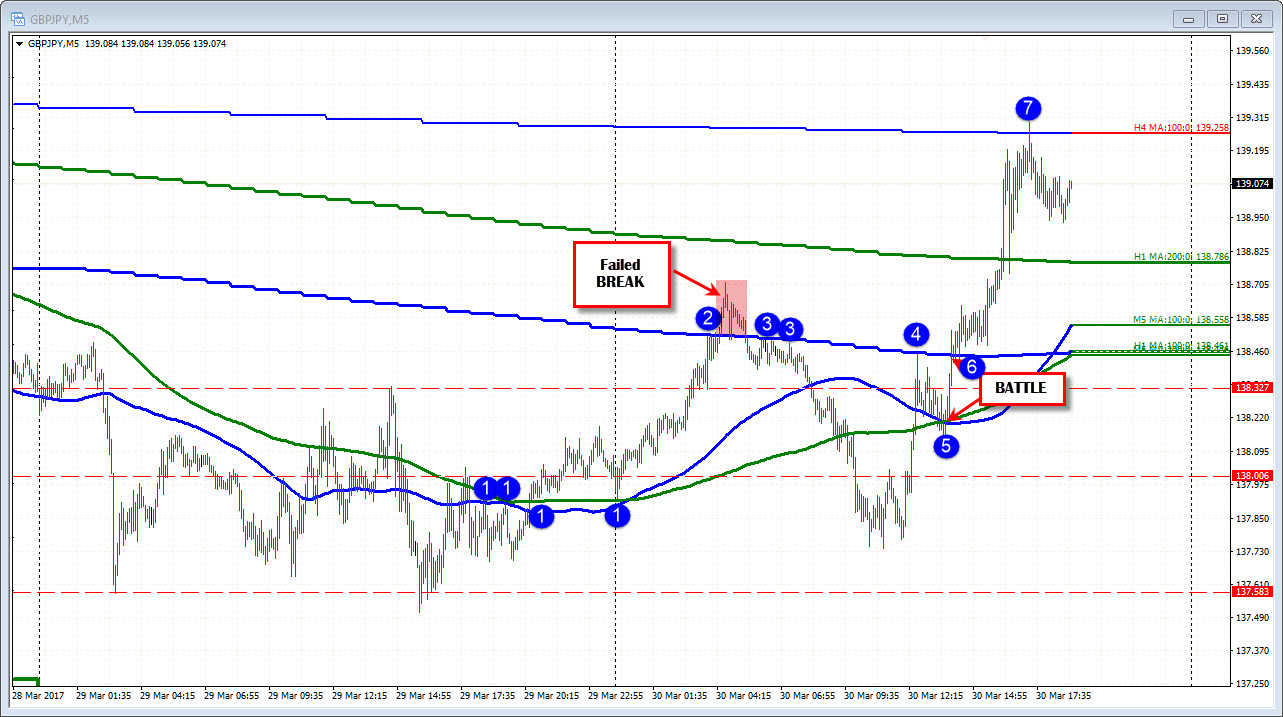
Looking at the 5-minute chart above, I have included overlays of hourly and 4-hour MAs within the chart. By doing so, it allows me to see the price action around those technical levels (whether it be an hourly MA or a MA on the 5-minute or 4-hour chart). What I look to do is look for reaction/patterns around those technical levels. If I see a reaction/pattern around the level, I assume "the Market" does too. That is key as you want others doing the same thing.
For example, going back to the end of yesterday and the start of today, the 100 and 200 bar MAs were converged. We know the fall yesterday from the 4-hour chart stalled near the trend line and could not get below. That may give the pair more of a "buy the dip" bias.
Going into the close yesterday the price moved above the MA lines and then tested the lines at the start of the day (blue circles 1). Those MAs define bullish above and bearish below. I (and other traders) can see that buyers used the level to buy/lean against at the start of the day, and the price moved higher.
When the price moved up to the 100 hour MA at blue circle 2, the price stalled. That was a level to sell. Buyers from below were selling there. There may have also been sellers against the 100 hour MA looking for a move back to the downside. What happened?
Well, the price did move above that line at blue circle 2.
Do you buy on that break above the MA line?
Yes. You could and should. It is a break.
However, what happens when the price goes back below? The buyers turn to sellers. You can see it at blue circle 3. Traders who bought on the break sold (got out) and new sellers entered.
Later after a pretty good move lower (profit potential), the price recovery begins. The price moves above the 200 and 100 bar MAs on the 5 minute chart, and ultimately retests the 100 hour MA at blue circle 4. What happens?
Sellers remembered that MA line and what happened earlier in the day (they can also see what happened).
The choppy market, sends the price down modestly to the the 100 and 200 bar MAs again at blue circle 5.
At this point there is a battle between the 100 and 200 bar MA below (at blue circle 5) and the 100 hour MA at blue circle 6.
What happens?
The price breaks above and sellers turn to buyers. The momentum is not great at first, but the price stays above the key 100 hour MA line. IF you bought on the break, the stop would be below the 100 hour MA line.
The price moves higher and ultimately reaches the 100 bar MA on the 4-hour chart and stalls (blue circle 7) just like it did the last time that MA line was tested last week. Longs exit. Sellers come in and look for a rotation back lower toward the lagging MA levels. Risk is on a break above in which case patient sellers would look for a retest of the topside trend line from the 4-hour chart, and see what happens there.
SUMMARY: In choppy markets like the GBPJPY, it can pay to be patient. Find some wide technical extremes that the market is paying attention to, and just wait in the grass. If they are tested, react. If it works, you will have great trade location. If it does not, get out. You are trying to trade with other traders who see the same thing and are patiently waiting too.
If you want to take advantage of the choppy moves intraday (that do have some pips), try to find some technical clues from the shorter term chart. Look for patterns at technical level. Trade what you see. Sometimes you may zig when you should zag or the market has a failed break like it did at blue circle 2. Those are the risks for all traders though. You may lose a little. Other times, you will catch a choppy trend move and be quite happy.
In each situation, it pays to be patient and wait for your spots. Once reached...react. If it works, great. If it does not do what you expect, get out and keep your risk limited.

