Tomorrow will be the 100th employment report since the Job depression started. Where have we been? Where have we recovered?
100 months ago, Non-Farm Payroll shed -86K thousand jobs. A string of 23 straight months of declines were then reported. That streak was broken with a gain of +28K, followed by a decline of -69K. That decline was the low point for the job depression.
That low point came after 25 months, where 8.699 million people lost their jobs. That is an average of -348K jobs lost per month. The largest monthly decline was -823K.
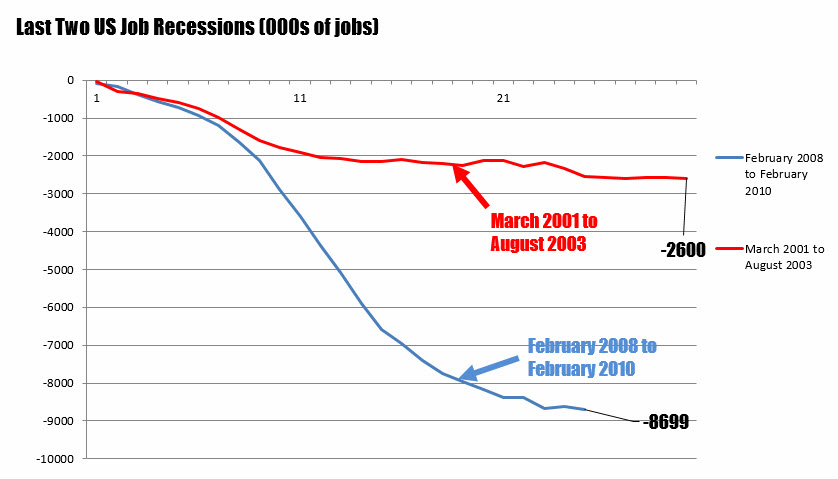
If you were to compare that depression, to the prior job recession that started in March 2001 and ended in August 2003, it is really no comparison. That job downturn saw 2.6 million jobs lost over a 30 month period - or -86.67K per month.
No contest. The chart above charts the cumulative job losses of the last two job downturns to their bottom. The top line is the path for the 2001-2003 downturn. The bottom line is the 2008 decline. Although the 2001 jobs recession took longer to bottom, the depth of the job losses in 2008 to 2010 was brutal.
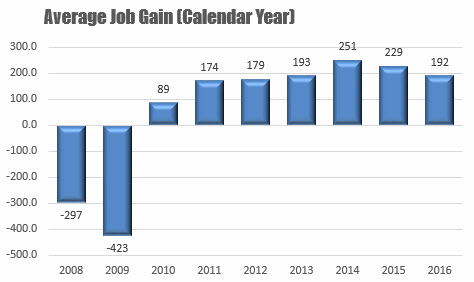
Since bottoming with the February 2010 employment report, there have been 4 months (alll within the first 7 months after bottoming) with negative job gains, and 70 months with job gains. The last 67 months have been positive. That is the longest winning streak of positive job results on record.
Since bottoming the cumulative Non Farm Payroll gain has totaled 14.182 million. With 74 total months since the jobs bottom, that comes out to an average gain of 191.6K per month. The average job gain for 2016 so far? 192K, right on the average. In 2015, the average was 229K. The peak was at 251k in 2014. The 2013 average job gain was 1K off the average at 193K (see chart below). It would make sense that we are on the downward side of the job engine.
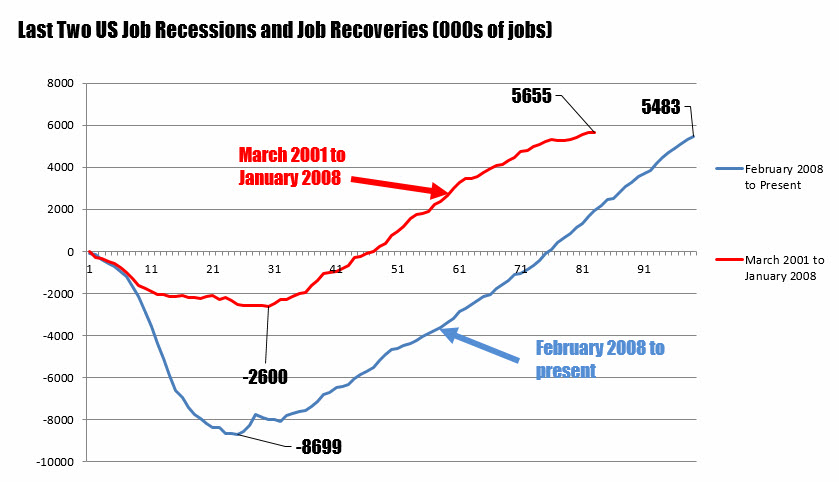
Charting the cumulative job losses followed by the recoveries (the recover from the 2001 recession, lasted until the start of the 2008 job depression), shows that in the 2001 to 2008 cycle, a net gain of 5.636 million jobs were created. In the current recovery a net gain of 5.483 million jobs have been created so far. If the expected 160K is printed on the 100th report, we will have surpassed the net gain from 2001. In the 2001 cycle it took 83 months to get to that figure. But remember, the bottom was at only -2.6M vs 8.7M. So relatively speaking, the recovery has been robust.
The chart below shows the full decline and rise back higher from each cycles starting point.
So where were the jobs lost in the job depression, and where have they been recovered?
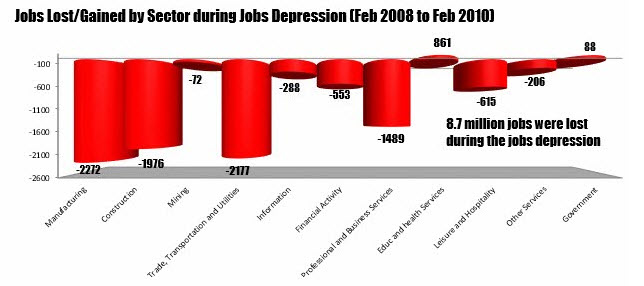
There are 11 categories that the BLS segregates jobs. The largest declines during the free fall occurred in Manufacturing, Trade, Transportation and Utilities and Construction. Each lost 2 to 2.3 million jobs. The only sectors that saw job gains was Government (fiscal policy) and the health sector (baby boomer demand). The chart above shows the cumulative job losses for each major sector.
Where have the jobs been created since the bottom?
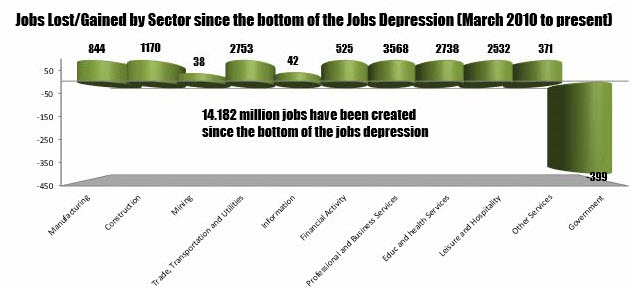
Well every sector with the exception of government (state and local governments have been forced to tighten belts hard). The winners are Professional and Business services, Health remains strong, Leisure and Hospitality (more people eating out) and Trade, Transportation and Utilities. Although Manufacturing and Construction have seen gains, the jobs created are still a far way away from the job loss target.
The below chart shows the net jobs gained or lost in each sector since the job depression started in 2008.
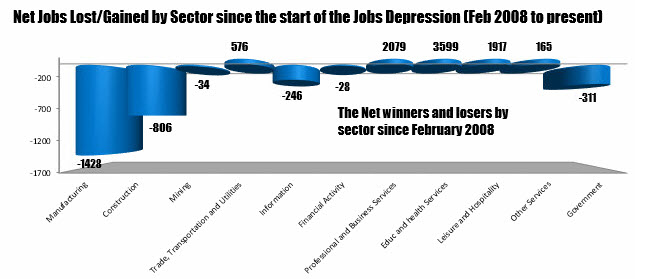
Clearly Manufacturing and Construction have suffered the most with a combined 2.234 million shortfall. Manufacturing jobs may have been lost as a result of jobs going abroad and/or increased efficiency from better technology. Construction has simply lagged as lending standards tightened and builders became more cautious.
There are other sectors that have also yet to recover including Information, Financial Activity (regulation?), Mining (the oil bust hurt), and Government (state and local governments).
Most of the net job gains have been in Health, Leisure and Hospitality (low paying jobs) and Professional and Business services. Of interest, is that Leisure and Hospitality has added a net 1.917 million jobs. Has the US replaced higher hourly wage Manufacturing and Construction jobs with lower paying service jobs? It seems that way. That may explain 1.5% to 2% GDP growth in one easy graph.
Conclusion:
100 months later, the market is expecting another 160K added in the plus column for jobs. Moreover it will be the 68th straight increase - another record. The Fed is thinking that we are near full employment as the pace of job gains have slowed, but remains positive. The unemployment rate also remains steady which indicates a full employment like economy.
However, if you speak to the middle class that filled the Manufacturing or Construction jobs, the jobs that have been gained, have not benefited their industries. In the past, those sectors likely benefited nicely from lower interest rates. Not this time, which may be a reason Fed officials - deep down - remain cautiously optimistic. Replacing the builders of goods, with the lower paying service employees is not a strong sign.
What needs to be changed?
The Fed is honestly pushing on a string. The real muscle work has to be done out of Washington and quite frankly American businesses. More logical regulation that is not a deterrent to business, along with a hard look at programs to get business back within the US borders. For the US businesses - if they want a healthy US economy which is a benefit to them - they will also need to compromise and think about bringing their businesses back to the US. At the end of the day, there will be a tipping point whereby, the marginal benefit from the $1 extra savings by going abroad, ends up having a marginal cost of >$1 by getting rid of another middle class higher paying job in the US.
Is the Donald or Hillary up to it? Is the Congress up to it? Let's face it, the Fed may not have to hike aggressively, but they also can't continue to push on the string and hope for everything to be alright or for the ship to right itself. It is time for change. Deep down (well not so deep down), I wish it was not The Donald. I don't trust him. Hillary is old school. Congress....can you WAKE UP!


