
It is the GPS for traders during high risk/volatile events.
When you have BIG events or releases, I encourage retail traders to wait for the results but plan the trade by being aware of key levels.
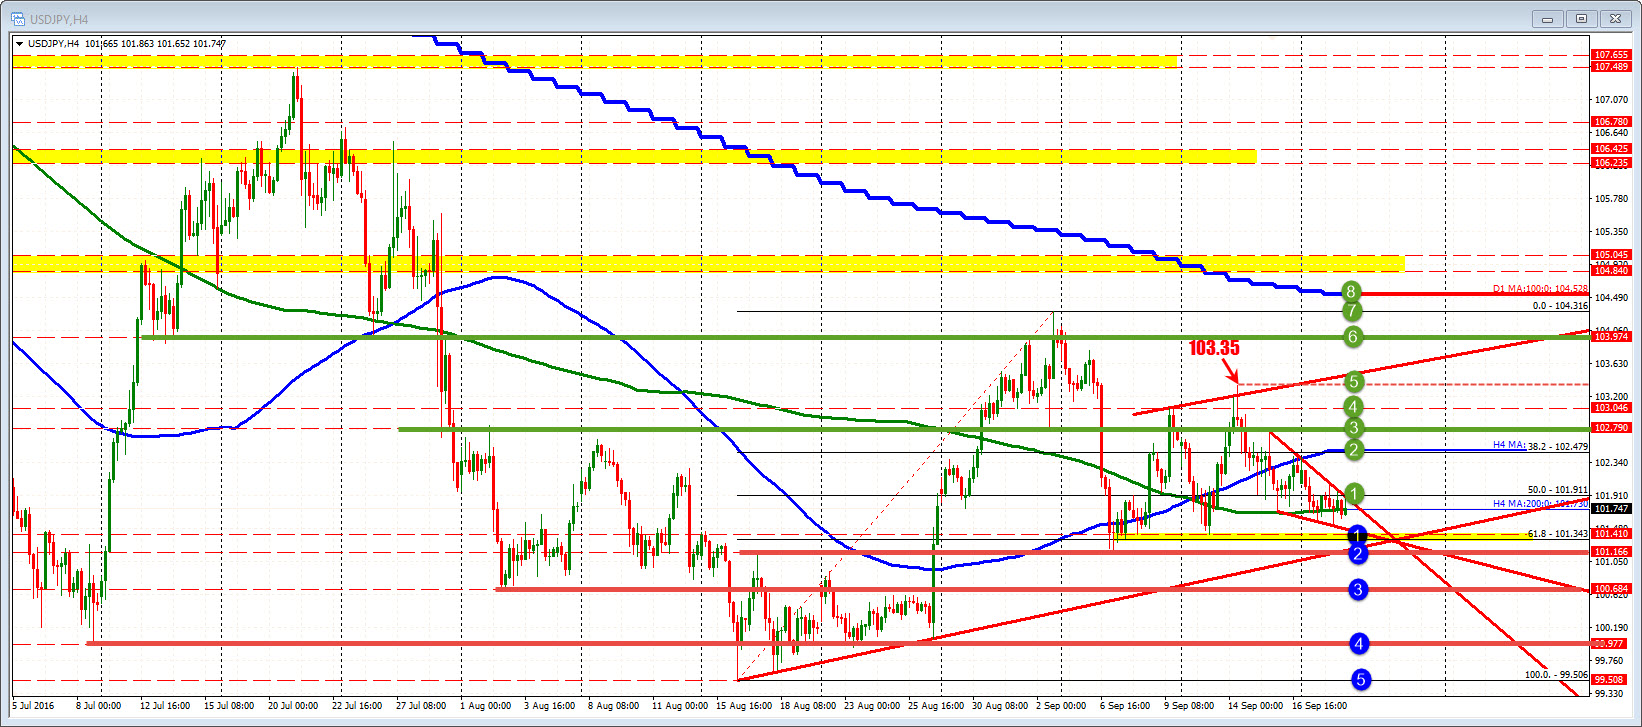
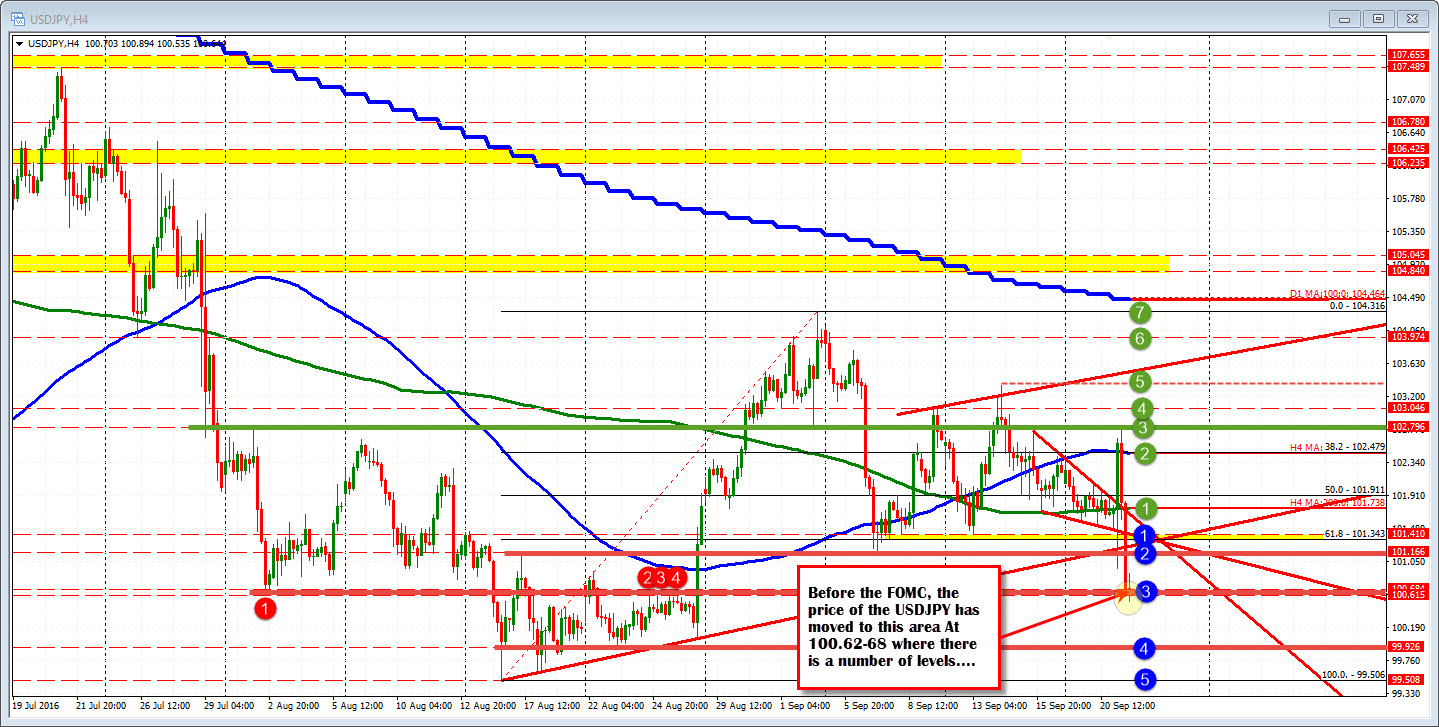
Yesterday, I posted the following chart for the USDJPY:

What I do is look at the chart and tick off levels that stick out technically. If the levels are view able by by myself, they are view-able by traders around the world. The chart is the picture most traders look at.
Why?
Well for many retail traders they don't see the trees through the forest of price bars. For me:
- I see bullish above/bearish below
- I see risk defined/ risk limited.
- I see failed breaks.
- I see "the markets" thinking.
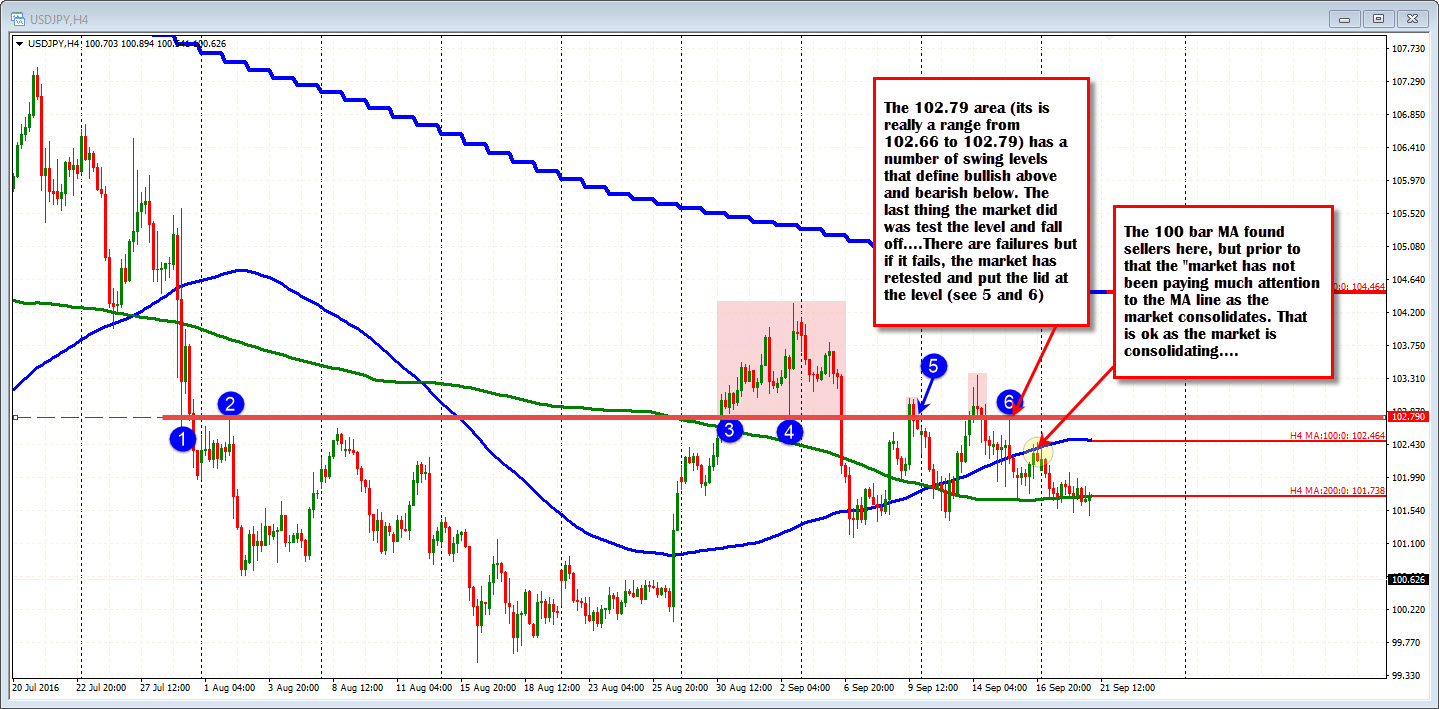
For example at the 102.79 level (see chart below that is stripped down a bit), I see the swing lows and swing highs at the level that defined bullish above/bearish below. I see risk. I see failed breaks (red areas). At blue circle 6, I see what the market was last thinking by stalling at that level. Traders leaned after failing on the break above. That is the "markets" last memories of that area.
Now that 102.79 level is one target level. The 100 bar MA on the 4-hour chart is also a level (blue line at 102.46). That line also does the things listed above - at times.
Has it been as important lately for traders?
Well it did stall the rally on Friday. That was the last thing it did, so it is in traders minds.
However, prior to that going back to September 7th, the market has not been reacting too closely with MA line (just follow the blue line in the chart below).
So which has been more a focus for the market? Probably the 102.79 level.
In planning a trade, if doing a rock, paper, scissors comparison of levels of importance, 102.79 might be a rock, while the 100 bar MA is scissors. Rock smashes scissors. Scissors can't hurt the rock.
If trading an event like the BOJ decision, traders should outline those levels that they see. If they see them, the "market" likely sees them too. From that point there is a road map to follow. Without it, the trader is driving without a road map or for those who don't know what a road map is, without Google Maps, Waze, or whatever GPS system you use on your smartphone.
So AFTER the event, when all is known and the reactions send the price here and there, you can look at your map and see the 100 bar MA and the 102.79 bullish above/ bearish below, line in the sand level. You don't need to sell at 102.79, you can sell on the break back below the 100 bar MA on the 4-hour chart (see chart below on what happened). You may not even sell until lower.
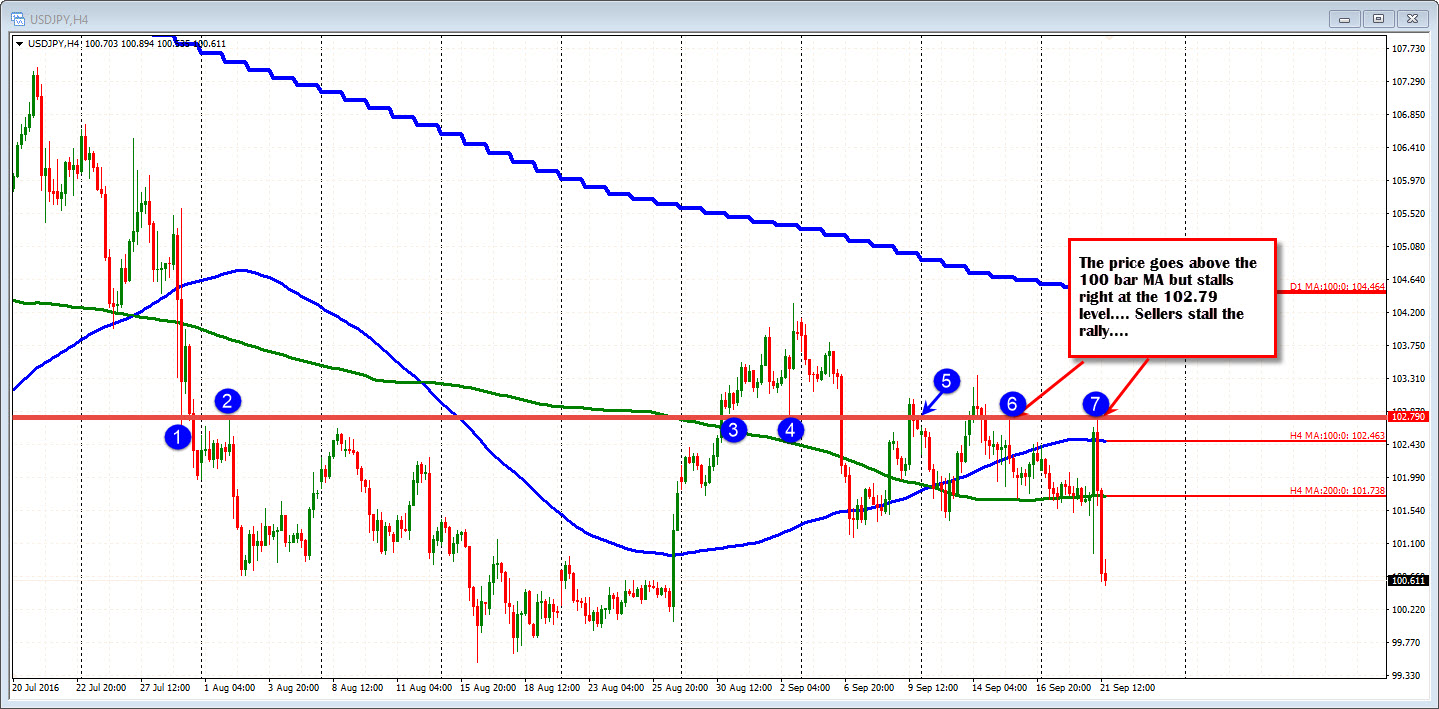
But the bias judgement from that point forward (i. e. bearish) comes from the inability to get above that 102.79 level. The "market" showed sellers at that key level once again. I can hear what the "market" s thinking, and that is selll/bearish. Risk is defined there. Risk is limited there.
The 102.79 was not broken, so there was not a failure, but the break of the 100 bar MA on the 4-hour failed. That tells me something. It tells me the sellers are taking control - as long as the price remains below the 102.79 level.
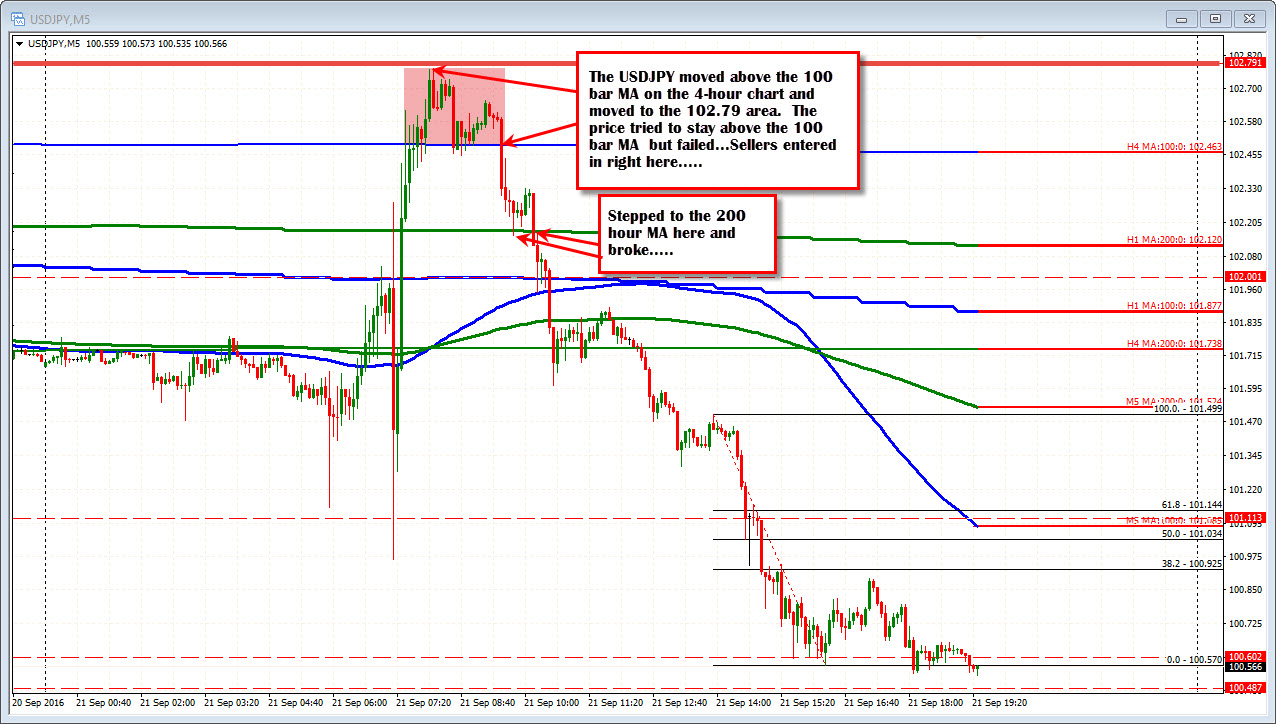
Looking at the 5 minute chart, note the price action at the overlay of the 100 bar MA on the 4 hour chart ("H4 MA:100.." in the chart below) and the 102.79 level. The market moves cautiously above the 100 bar MA line, works up to 102.79 (high reaches 102.774). The price corrects back to the 100 bar MA once again (red area). It tries to hold and go higher but what happens? It fails. Sellers in charge.
The failure takes the price down to test the 200 hour MA (H1 MA: 200 green line), That is broken and the price simply steps down, from level to level to level. The move higher is unraveled.
So where does the market go?
The low for the day is stalling near the 100.615-100.684 where there were a number of lows and highs. That area is where we wait before the FOMC decision.
What will the Fed do? What levels are in play through that key event?
After the FOMC, the next target - should the downside be explored further (dovish Fed) -comes in at 99.92 and then the 99.50 low in mid-August. A move below, opens up the door for further declines. The post Brexit low targets 99.00 area in the pair. Below that, and we are into new 3+ year lows for this pair.
What about the road map for the upside?
Take back blue circle 2 in the chart below. Take back blue circle 1, and start to head up the green circles in the chart below. They are simply levels I see, and the rest of the market can see.
Who knows. if the Fed surprise with a hike of 25 basis points, the price may be back up to that 102.79 level once again. It certainly could happen given a surprise and we know the importance of that level too.
Be aware. Be prepared. Plan your trade.

