
What has it done technically?
If you were to rank the strongest and weakest currencies today, you would find that the EUR is the strongest, while the CAD is the weakest. For the EUR, it is up on the day against all the major currency pairs, while the CAD is down against all the major pairs. If you looked at the currency pair that has moved the most today on a % basis, the EURCAD is the biggest mover (makes sense right). It has move up by 0.72% at the time of the snap shot.

That tells us the numbers story at a point in time. Why is the EURCAD the strongest of all? What is the fundamental story?
HMMMMM. Well, oil is down. Both WTI Crude and Brent Crude are down about $0.90. When oil goes down, it could pressure (it does not always but can) the CAD as Canada is an big producer and exporter of oil.
So all things equal, that might explain the rise in the EURCAD. If the EURCAD goes higher, the EUR is stronger and the CAD is weaker.
What about the EUR side? Europe imports oil. So that might be a benefit to have lower oil prices. Anything else that might be a reason for the EURs strength? There is not a lot of news out there, honestly.
What about the charts?
Well, let's look at the EURCAD and see what the technicals are saying to us?
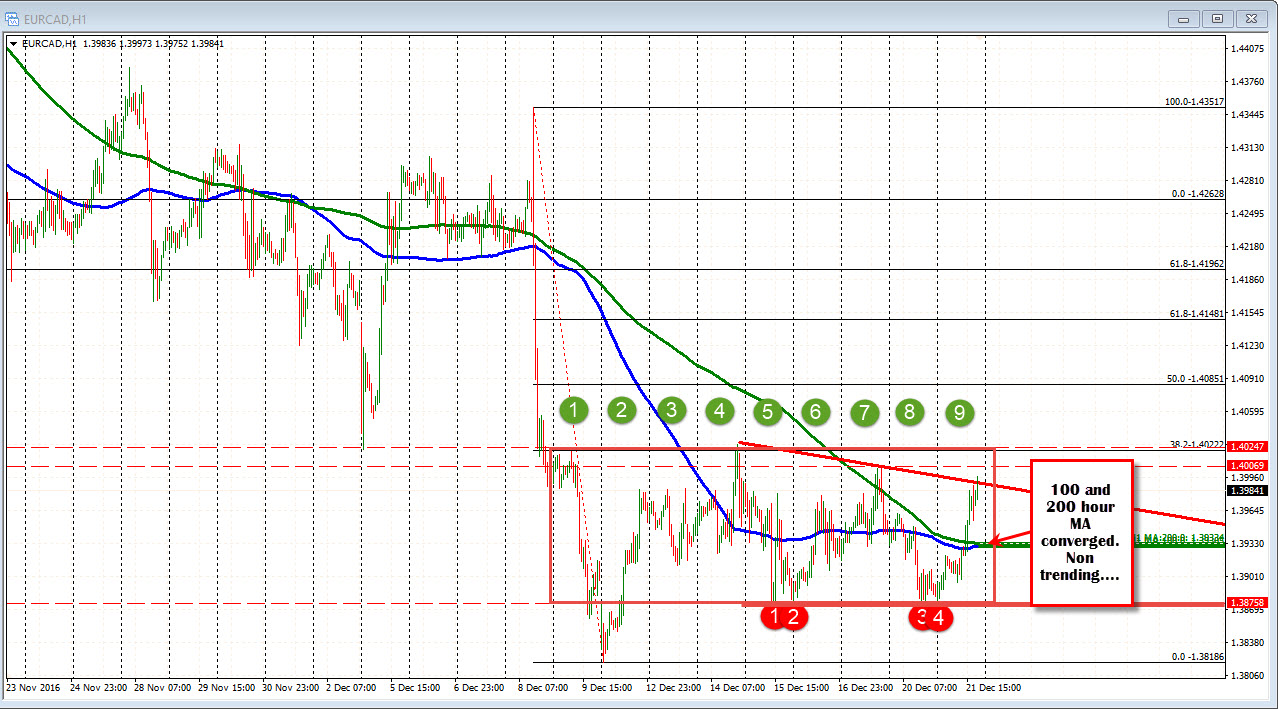
If you look at the hourly chart below, what do you see? What do I see?
I see a floor at the 1.38758 area. There was a low on December 15 at that level. Yesterday, and again at the start of today, that level was tested. That level held. Buyers leaned against the level on 4 separate occasions. If come the 3rd and 4th time the price action is not going below the 1st and 2nd lows, it says to be that the floor is being established. Stay above and it is more bullish. Move below and it is more bearish. It also says to me, the sellers have had their shot to go lower. In fact there have been 3 shots to take the price below 1.37558. Each failed to do so. Sellers are running out of excuses. Buyers are showing up. That is somewhat bullish.
Now do we know that the EURCAD is going to be the strongest currency of the day at that time? No. In reality the "being the strongest just happens" as time goes by but the first clue - is more bullish.
What else do I see?
Look at the 100 and 200 hour MAs (blue and green MA lines). They are converged. They are both going sideways. That says to me that the market is non trending. When the MAs are going sideways - and they are long like 100 and 200 - that says up and down unsure of direction market. Is that bullish or bearish? To me if the price is below it is more bearish but if the price goes above it is more bullish. At the start of the day we were below the MA lines, so more bearish BUT what gives a cautious slant is the floor below. There is a battle early on. That battle turns more bullish on the move ABOVE the 2 moving averages. At that point, there are 3 reasons. 1. Floor holds. 2. Above the 100 hour MA and 3 Above the 200 hour MA. Do you see that? I do.
It is at this point that the EURCAD got it's bullish push that propelled the pair to being the strongest currency pair. We did not know how far it would go but there was reasons from the technicals for more bullishness and it happened.
Looking at the 5- minute chart, you can see the more buying interest (see chart below). Note the overlay of the 100 and 200 hour MA and the price action near those MAs (they are marked H1 MA: 100 and H1 MA: 200). . The price moved above those levels at 1.3930-33 area, then corrected back near the 100 hour MA. Buyers came in near that level and pushed the price higher.
Like at the floor, buyers leaned against the technical level. We did not know how far the price would go from there, but the bulls are showing their hand.
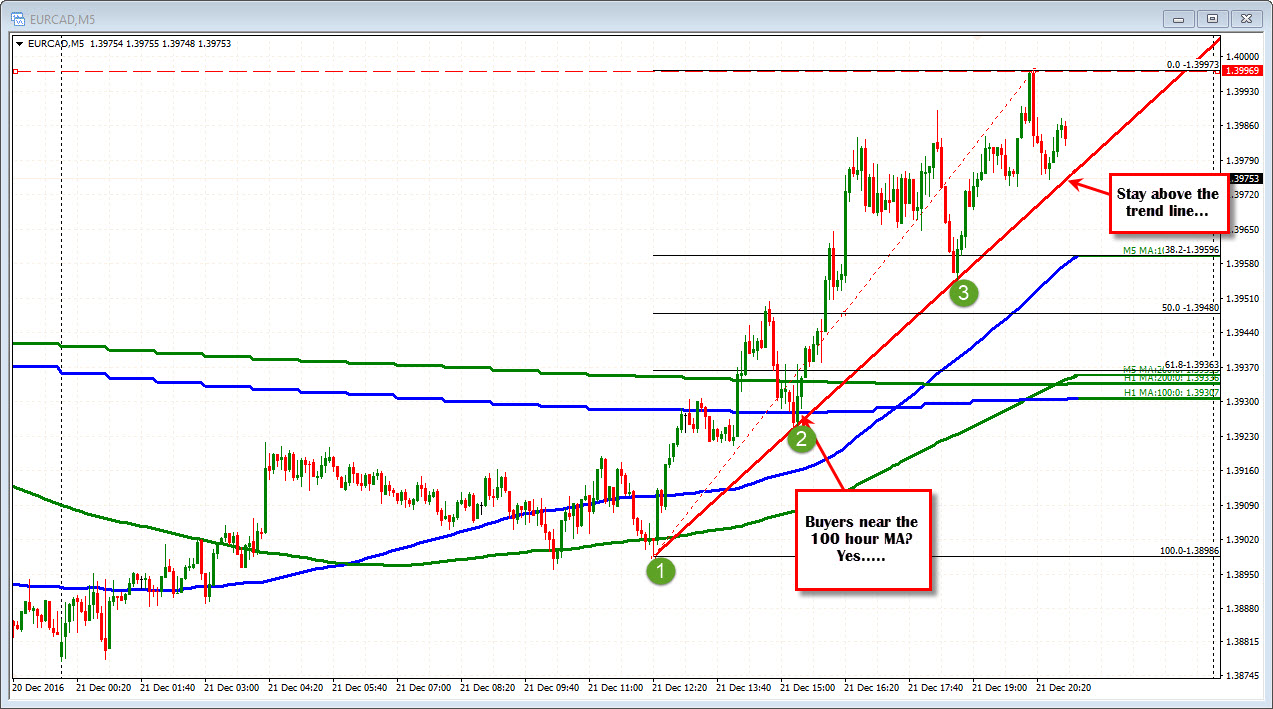
The price ended up extending higher and moving up to 1.3997. It ends up being the strongest currency pair of the day.
Can we expect the pair to remain more bullsih? Can we go even higher?
Given what I see, the price has a chance to move higher and move outside the Red Box. Why?
- 9 days of up and down. The longer the market non-trends the better the chance for a break
- The strong floor. If the price cannot go lower, it has to go higher
- THe breaking of the converged MAs. This is the bias clue. If the price can stay above those MA levels, the buyers remain in control. Now the upside has a better chance of being broken. If the price does not break below the lower half, the upside half is easier to break.
Will it be easy? No. Looking at the hourly, there is a trend line near the 1.4000 level that is slowing the rise. The highs are just as strong as the floor. There are two highs near 1.4021-27 area, and the 38.2% retracement is at 1.4022. BUT if broken, the should solicit more buying.
IN summary, the strongest pair of the day happens, but there may be some catalysts that propel the pair to it's status. We as traders have the ability to see it as it happens. If we can latch onto relative strength of the currency pairs and take a look at the technicals and the fundamental story, we may be able to sniff some of the moves out BEFORE they happen.

