
Technical analysis offers a lot of instruments to determine important levels. We draw these levels through previous highs and lows, find them with the help of Fibonacci tools and pivot points, trendlines etc.
At first sight, the theory is simple: when the price breaks an important level, it means that it should continue moving in that direction.
Learn more about technical analysis here
In practice this happens only if a break is real, which is not always the case. Sometimes, a price goes beyond an important level, but fails to develop an extensive move. Instead, it returns to its previous trading range, and the breakout turns out to be false.
How can we know if a breakout is true or false? Right after the price moves through a level, it can be either of the situations. Yet, it's evident that approach to trading in each case should be different. Let's go through several techniques which will help to choose an effective course of action.
A breakout needs a level
It's worth of contemplating a breakout if there's an important enough level to break. The more times a price touches support/resistance/trendline, the more valid level you managed to find. Such price patterns as channels, triangles and flags can be truly valuable for the identification of potential breaking points. The more important the level is, the harder it will be for a price to break it. At the same time, a real break of such level will have a more far-going consequence.
Trading false breakouts
Remember that there are more false breaks than true breaks. What actually happens is that amateurs rush into the breakout trade and get wiped off the market by larger players.
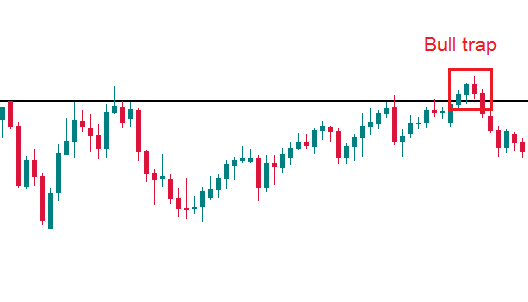
A false breakout can be classified as such when a price returns to the previous trading range and fixes there. It may happen instantly after a price pierces an important level or after up to 4 candles beyond the level. The latter is referred to as bull/bear trap. Reversal candlestick patterns in the vicinity of a "breakout" level tend to give reliable hints that a break has failed.

False breakouts are best traded in the direction of the trend. Note that smaller timeframes (M1, M5, M15) are not good for trading false breakouts as the price action is too chaotic. We recommend analyzing H1 and higher timeframes for that purpose.
A particular case to mention is the so-called Fakey pattern or, in other words, a false break of an inside bar. If you see an inside bar, its break as well as the break of the senior bar, you can expect with a substantial probability that this break is false.

Trading a real breakout
An attempt to enter the market in the direction of a breakout should be realized with greater cautiousness. In many cases simply putting a pending order, for example, a Sell Stop a bit below a support level, may trigger your entry order and then lead to loss when the price returns higher.
To solve this problem, some players put entry orders for a short position below the candle, which broke the level and closed below it. Even so, the risk of a false breakout and, consequently, failure remains high.
In order to augment your chance for success, have a look at what kind of candle appears when the price approaches the breakout level. Its length should be 2 times or at least 1.5 time bigger than average. The breakout candle should have a full body (it can't be a doji or a pin bar).
If the candle is full-bodied and closes below the support level, wait for yet another candle. This second confirmation candle should be smaller than the breakout candle and it should also close below the breakout level.
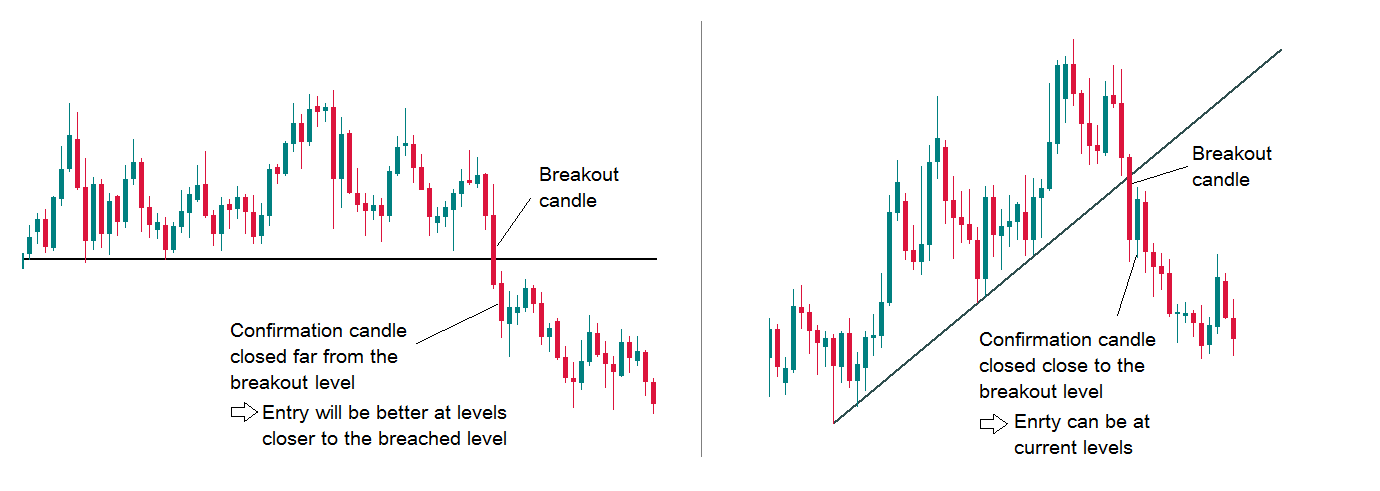
If the confirmation candle closed close to the level, we may enter at the market price. If the candle closed far from the level, we put a Sell Limit closer to the breakout level.
In chart patterns like head and shoulders there's often a retest of a broken level. Don't be in a hurry, you will have your time to enter the market.
If you decided to pursue a breakout, it means that you are taking higher risk than otherwise. This higher risk should be reflected in your risk management: it's recommended to move stop loss order to break-even level fast (compared with range and trend trading).
The risk/reward ratio can be up to 1:4, 1:5. You may use scaling out (partially close the position as the price moves in your favor).
Don't forget to take into account factors like market's sentiment, economic news and common sense. These things can give you hints about the nature of the price action you are witnessing on the chart.
Whether we talk about a false or a real break, "confirmation" should be your magical word. The "reality" of a break requires more confirmations than its falsehood.
This article is provided by FX broker FBS

