
Is it setting up for another fall?
Looking just at the 5-minute chart, the price of bitcoin has been swinging and swaying above and below the 100 and 200 bar MAs (blue and green lines respectively). There are times when the price tests the MA lines and there is a rotation lower (or higher) off the lines.
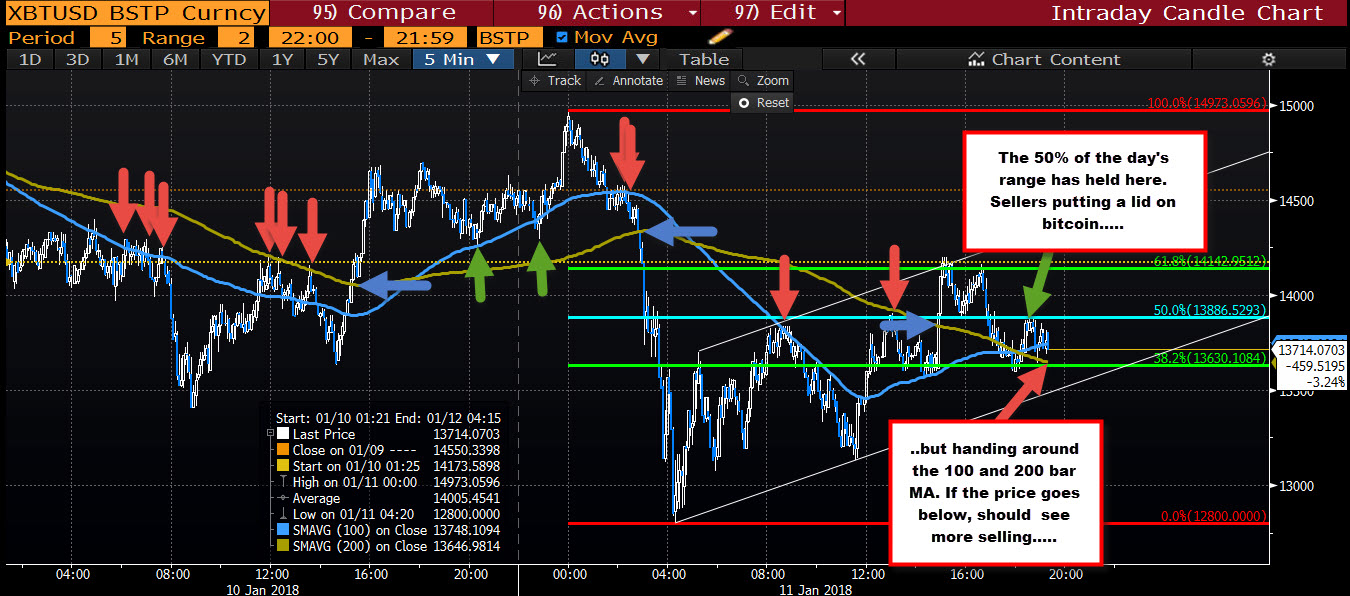
Then there are other times (see blue sideways hours) when the price moves from above to below the MA lines or moves from below to above the MA lines. At those times, the price bias changes from bullish to bearish, or from bearish to bullish.
What is happening currently?
For traders if you look at the blue and green MA lines, they are converged (close to each other). The price is trading relatively quietly above and below the lines.
The lull will eventually lead to a break and run.
The price in the last hour or so stalled at the 50% retracement of the day's trading range. Is that ceiling saying the sellers are setting up for a break lower?
Perhaps... What we can say is if it does hold and the MA are broken, we could see more selling technically from the price action. If it fails, traders selling will likely give up on the short and buy back.
So it is a key intraday monent for bitcoin.

