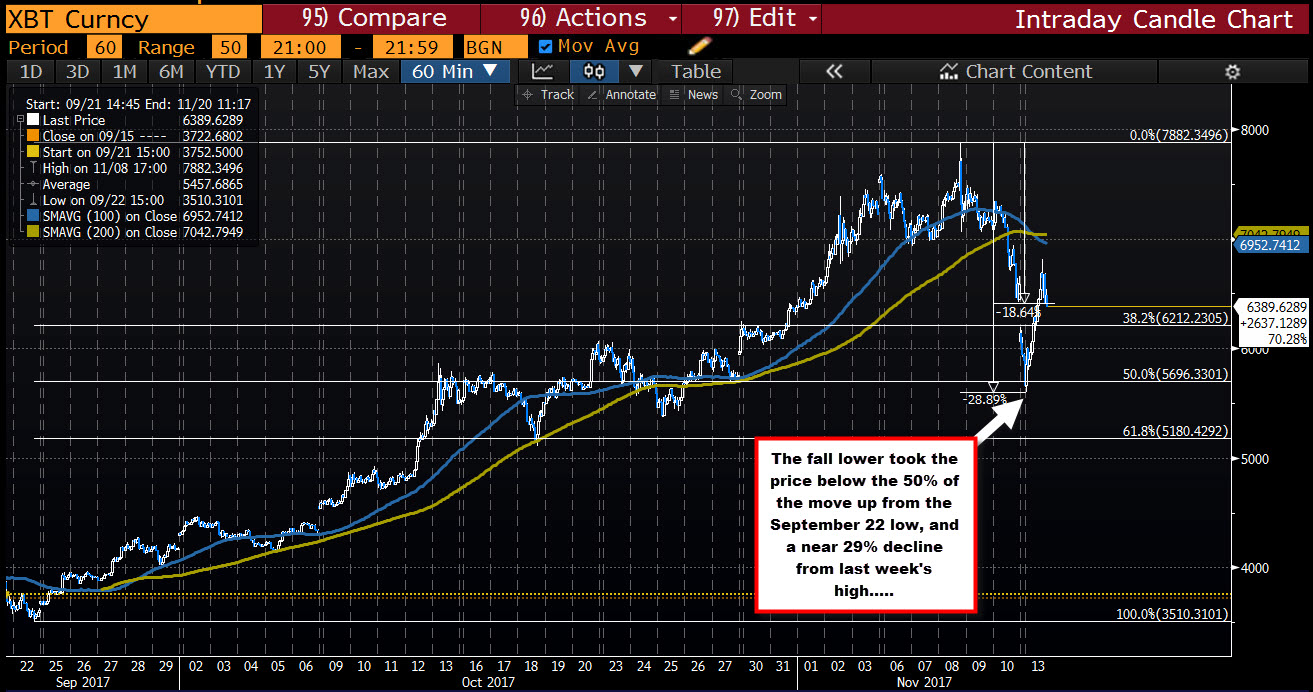
Near 29% decline from last weeks trading
Bitcoin plunged to a near 29% decline from last weeks high at $5605.00. That was down from $7882.35 last Wednesday. The fall took the price below the 50% of the move up from the September 22nd corrective low (at $3510.31) at $5696.33.
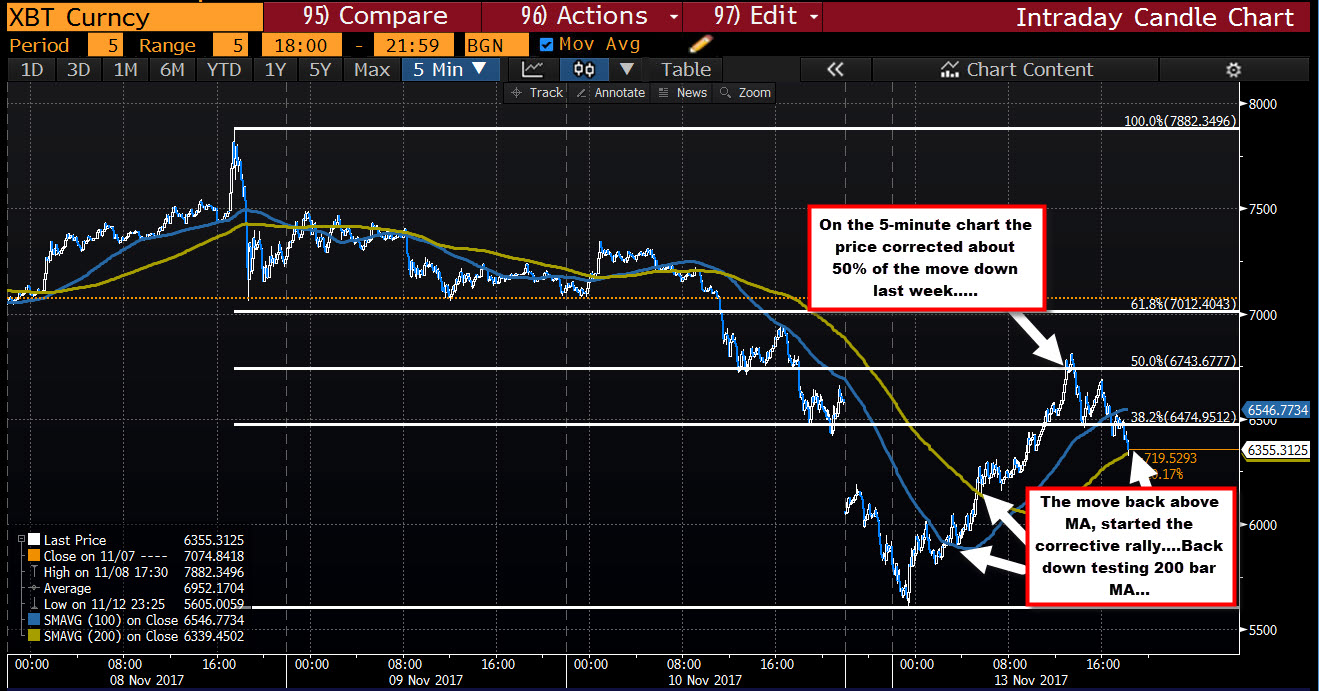
True to form, there was a bounce (there always is a bounce).
Looking at the 5-minute chart below, that bounce took the price above the 100 bar MA on the 5-minute chart and then the 200 bar MA on the same chart (see green line in the chart below).
The rally took the price up to $6811, above the 50% of the $2277 decline (50% at 6743.67).
What now?
We have since fallen back lower and are currently retesting the 200 bar MA on the 5-minute chart at $6340 (green line - see chart below). Key test for the cryptocurrency. A move back below, and the sellers will back in control. Hold and the buyers will being felling confident once again (well if it can get above the 100 bar MA (blue line at 6544 area).