
July 2012 swing low
The EURUSD has been running higher since the ECB meeting minutes were more hawkish
That run higher has taken the price up to the 1.2042 level (see earlier post outlining this target level). That level corresponds with the swing low from July 2012. The high just reached 1.20438. Is it enough?

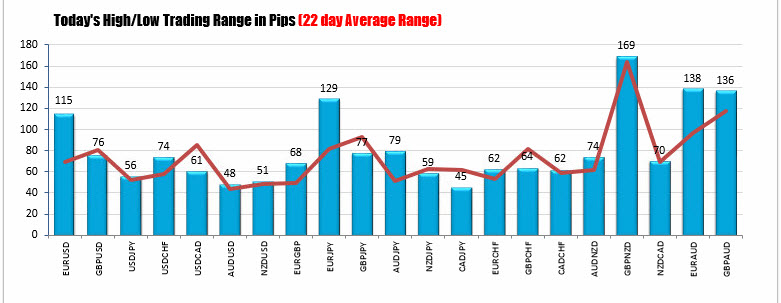
Well, the range is extended at 115 pips for the day vs 69 pip 22 day average. The 1.2042 is a level that sticks out. So it is a level to lean against for a corrective breather for traders.
However, drilling to the hourly chart below, there could be another run higher toward the 1.2061 level.
That level corresponds with the underside of the broken trend line. Last week that trend line was broken to the downside, and after a retest, the price trended down to 1.19152 low. It based and restarted the run higher today. There are a number of different points on that line (see red numbered circles). If there is a final run higher, I would look for sellers against the underside of that broken trend line (see hourly chart below)

Buyers are winning. A target has been reached. The market is trending. It is hard to pick a top in a trending market. If you do, do it at a level where risk can defined and limited as trend moves can go and go - squeezing shorts in the process.
The 1.2042 is a level to lean against, but the 1.2061 is another upside target that could be a stall point too. Risk for strong bulls is now the 200 hour MA at 1.2001-1.20044 area. That was the break point on the hourly today (200 hour and 50% retracement).

