Good ceiling at 200 bar MA on 4-hour chart. Support today vs 100 hour MA.
The EURUSD is trading above and below the 50% midpoint of the 9 day range. That level comes in at 1.1804. The price is trading right at that level as I type.
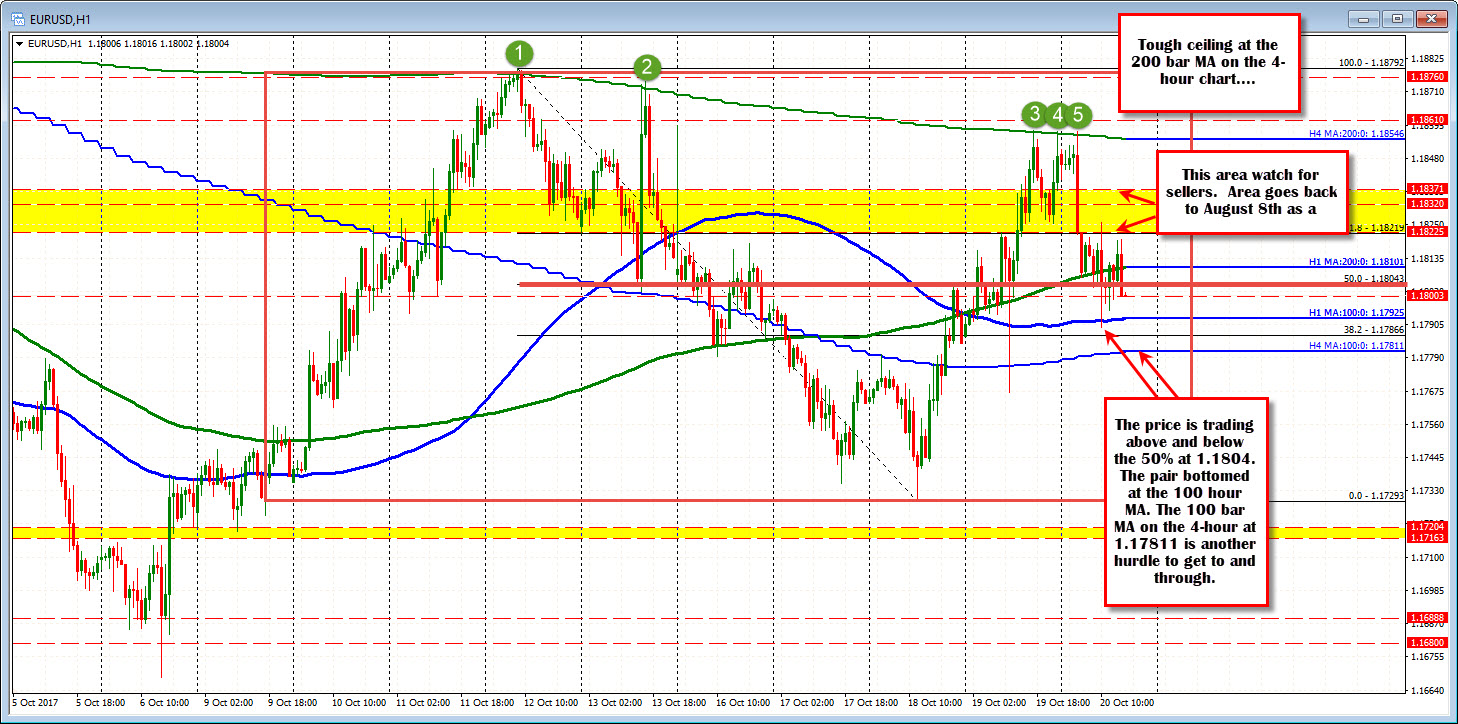
Yesterday and again in the Asian session, the pair had flirted with the 200 bar MA on the 4-hour chart on 3 separate bars. The Trump tax news pushed the dollar higher and the EURUSD lower and away from that MA line. The last 5 times up to that MA line held. So earmark that MA for a future ceiling down the road, should it be retested (again).
The fall lower has not only moved the price toward the middle of the range, but has also moved the pair toward a cluster of MA including the 200 hour MA at 1.18101, the 100 hour MA at 1.17925 and the 100 bar MA on the 4-hour chart at 1.17811. The middle MA (100 hour MA) stalled the fall (blue smooth line in the chart above). A move below now would still have the hurdle at the 1.1781 level to get to and through.
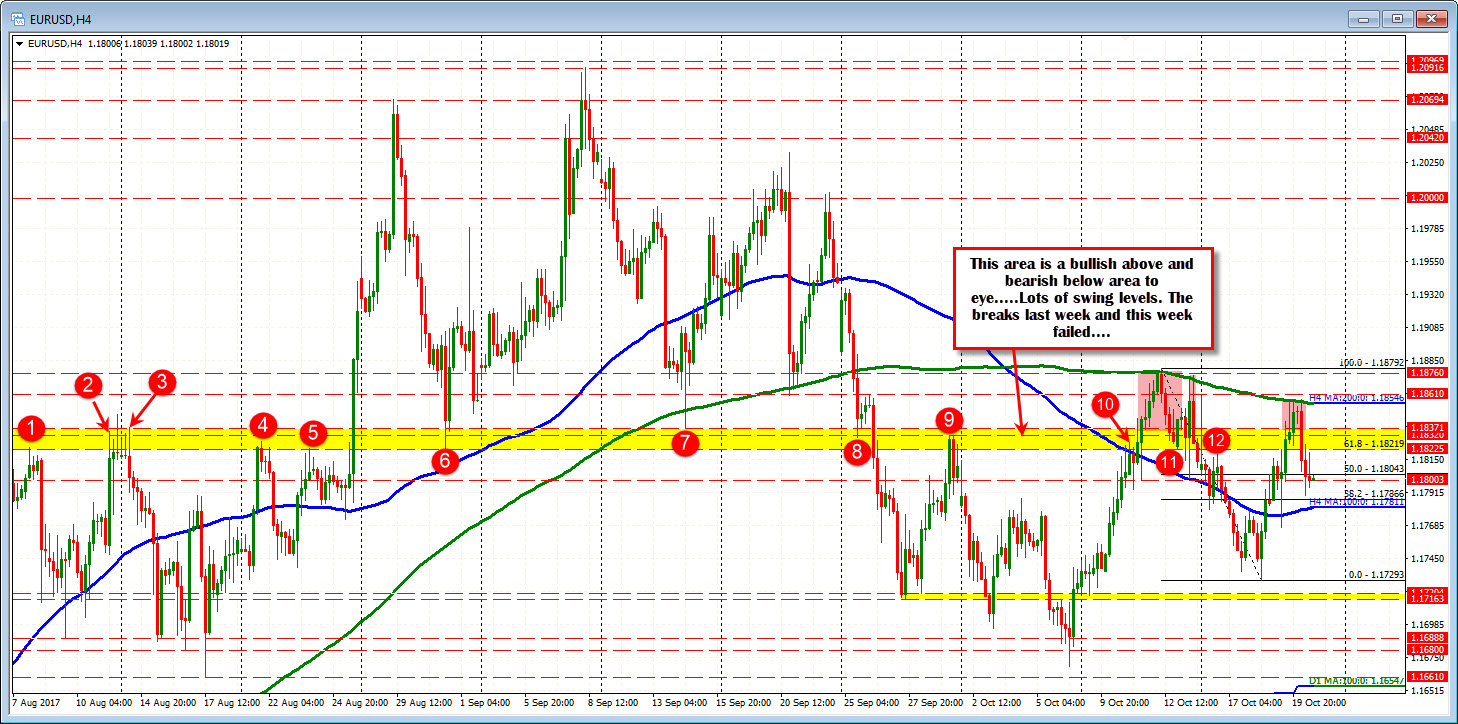
ON the topside the 1.18219 to 1.18371 will be eyed as resistance. It is a "bullish above and bearish below" area (see yellow area in the 4-hour chart below).
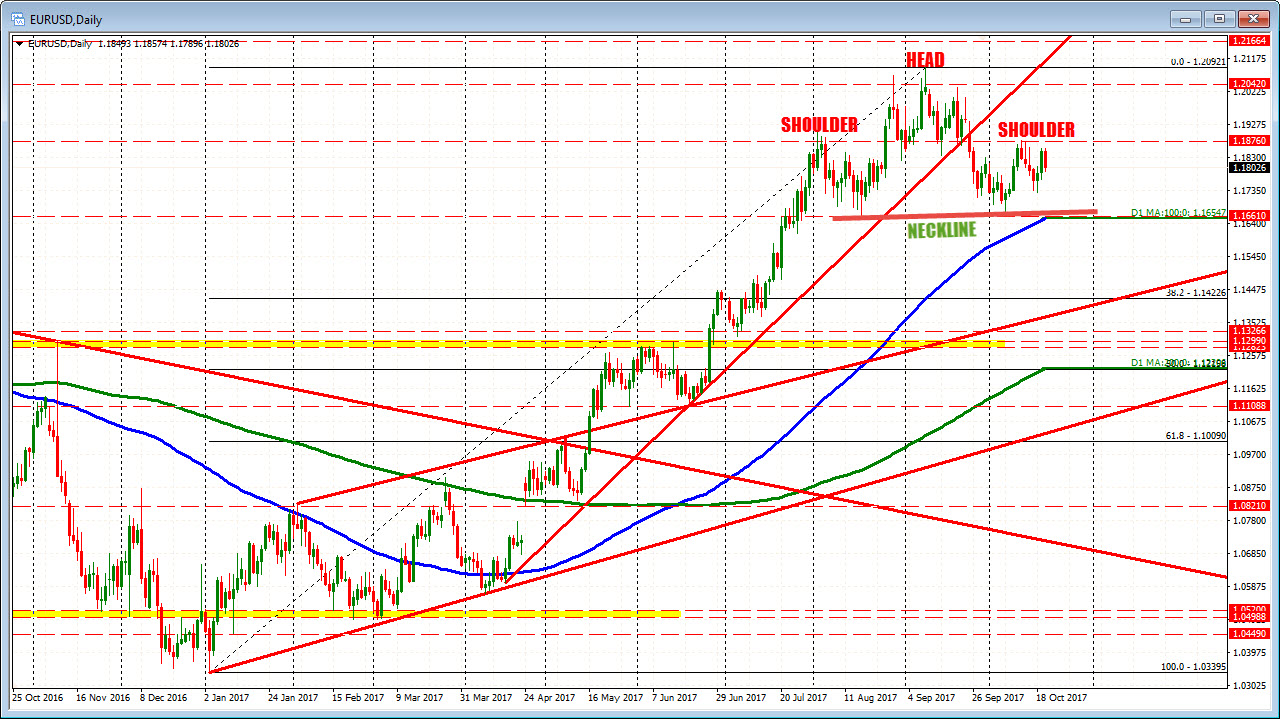
Looking at the daily chart, the Head and Shoulder formation remains a possiblilty. It does not mean it will happen (or be completed on a break), but it looks like one.....