AUDUSD moves back to the 50% midpoint of the move up from Dec 2016 low
The dollar is getting hurt on the back of the Fed's inflation concerns and in the process the AUDUSD - which was already rising today - has moved even higher.
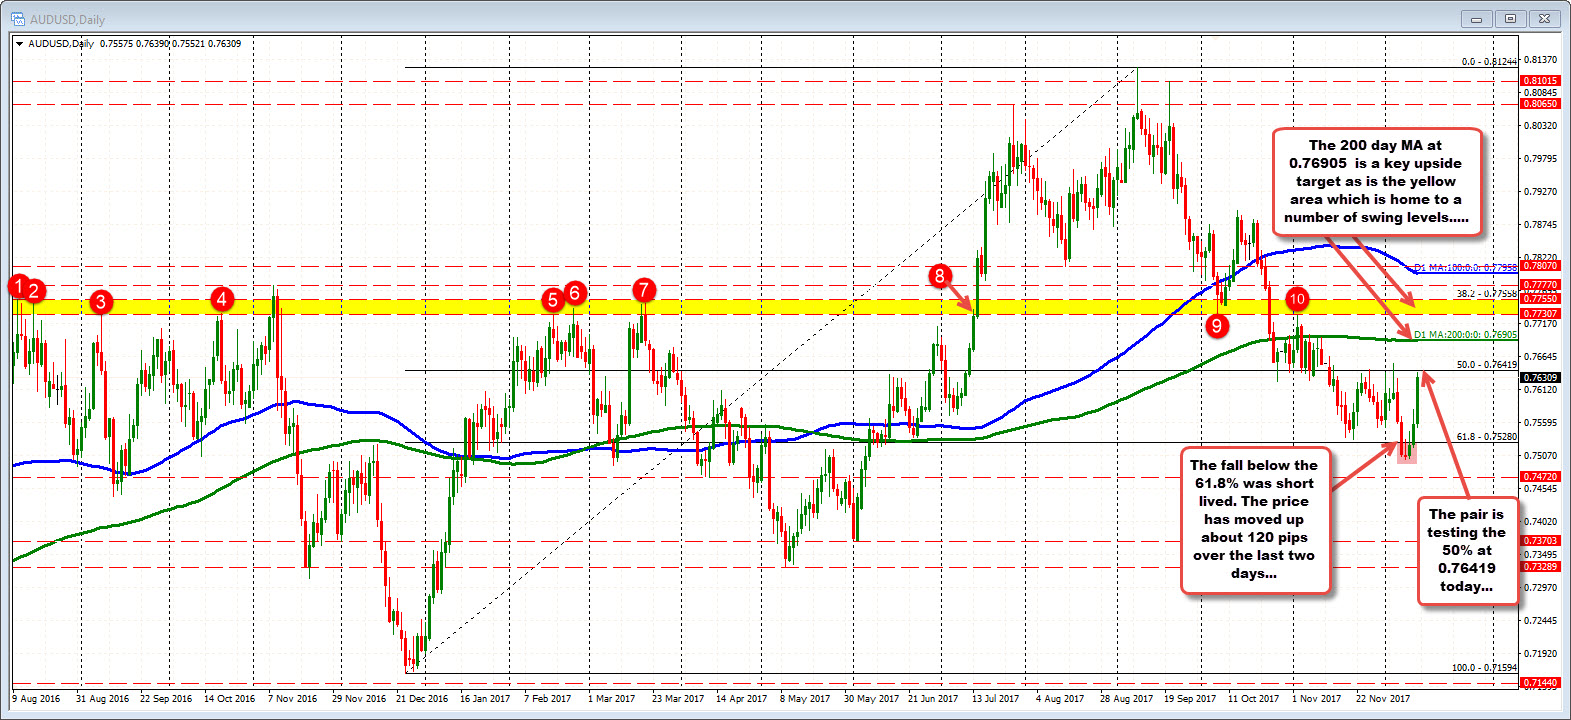
The pair has reached up toward the 50% of the move up from the low from December 2016 (about a year ago). Since that low, the price made two major steps to the highs at 0.81244 in September.
The last 3 month's has seen those gains erode. The low - reached last week - fell below the 61.8% of the move higher at 0.7528. There were 3 closes below. The last two day's has seen a 120 pip rise back higher.
In the new trading day, the Australian employment report will be released with the expectations for an employment change of 19K vs 3.7K last month, and for the unemployment rate to remain at 5.4%. The 3.7K number was the lowest of the year. The highest was 55K. The average over the last 12 months has been about 29K. So the expected number is on the lower end of what has been average. The expectation for policy in Australia is steady as she goes. China - a key support for the Australian economy - is expected to have slower growth in 2018 as they transition and try to improve the ecology and the financial system.
As mentioned, the AUDUSD has moved up today toward the 50% of the year long range at 0.76419. That level will be a barometer for bullish and bearish bias.
Getting above the level on a stronger than expected employment report, should be more bullish for the pair.
The 200 day MA - green line in the daily chart above - will be the next major target. That MA comes in at 0.76905. Since falling below that MA on October 26th, there has only been one day where the price closed above the line. Look for sellers on the test with stops, and new buying, on a break above the key MA line.
Keep in mind that on a bullish move, the 0.73307-55 is another key target that should be a tough nut to crack on any rally. I doubt we approach that level in the new day, but it remains a key upside resistance area.
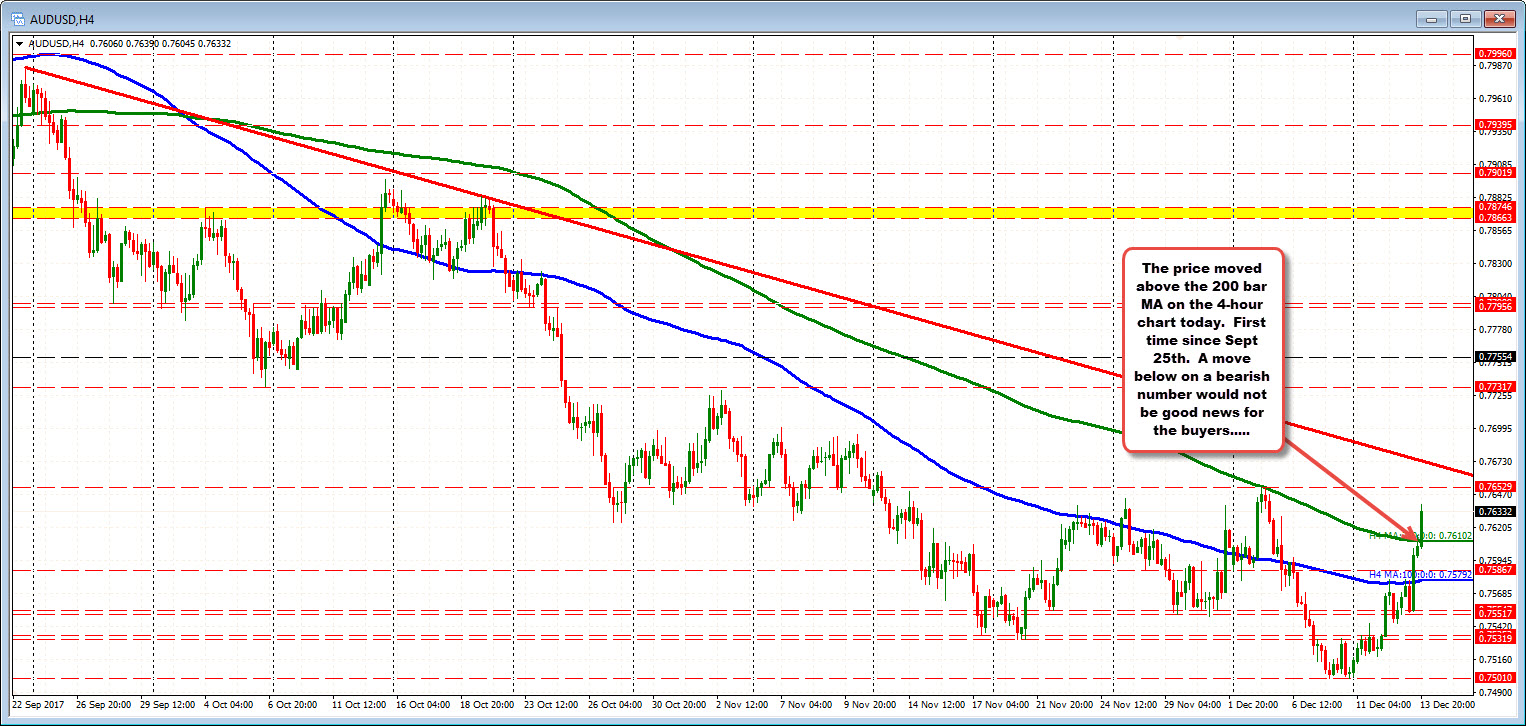
Should the price move lower on a weaker than expected report, look for the pair to move down to test the 200 bar MA on the 4-hour chart (green line in the chart below). The price today was able to crack that MA line for the first time since September 25th. A move back below would not be good for the buyers. I would look for buyers today, to turn back to sellers tomorrow - or at least to the 100 bar MA on the same chart at 0.7579 (blue line in the chart below).