Levels being taken out one-by-one
The Nasdaq is trading sharply lower. The low today reached 7195.03.The high was up at 7303..189. We currently trade down -136 at 7209.60. It is not a good day and it has not been a good week.
Technically, the index is taking a controlled bearish walk lower.
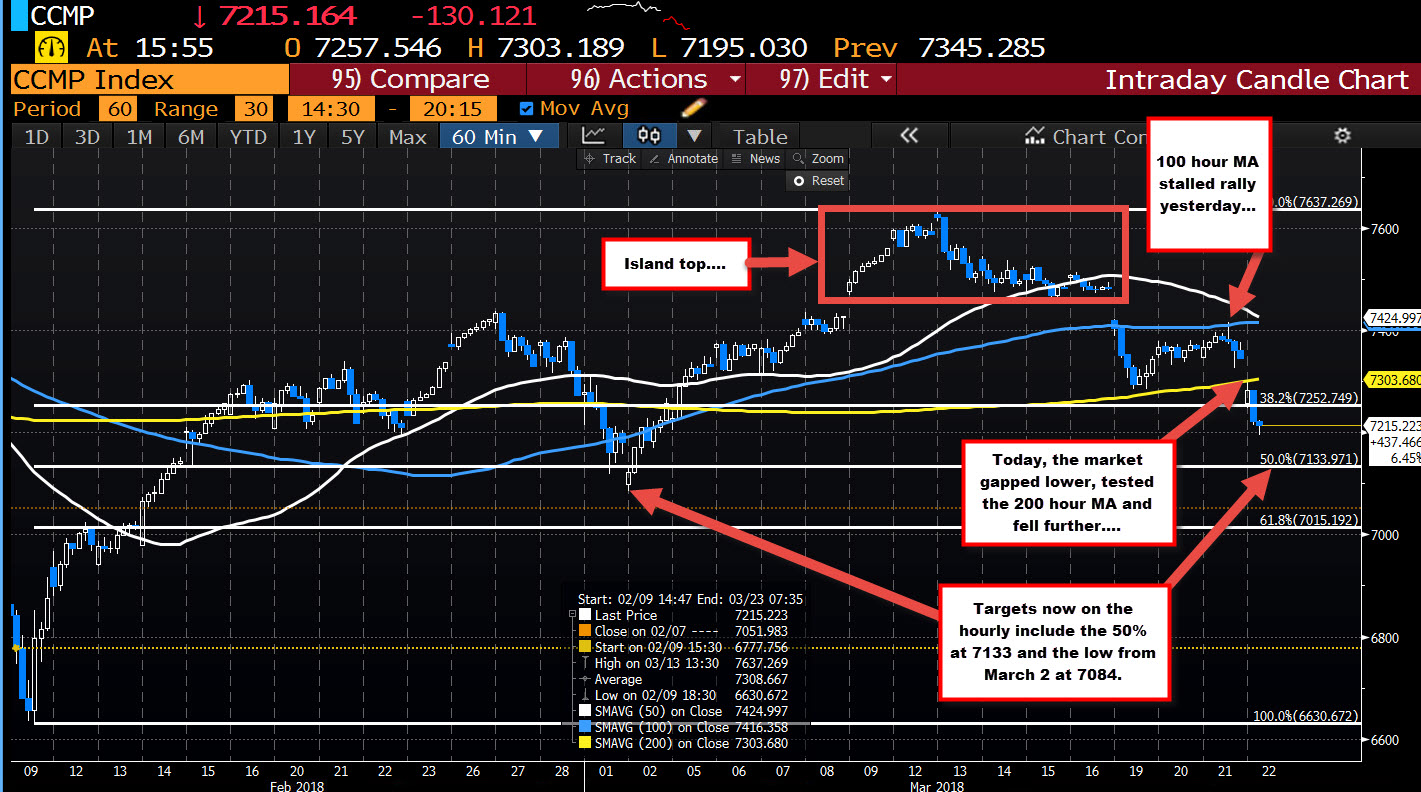
- On Monday, the price gapped lower. That move left an island top. Back on March 9th, there was a gap higher. That island is bearish technically.
- The fall on Monday cracked the 100 hour MA (blue line in the chart above)
- The fall took the price to test the 200 hour MA (lower MA line) at the Monday lows. Buyers leaned.
- The market corrected higher and consolidated on Tuesday and Wednesday. The high yesterday stalled near the broken 100 hour MA. The bears stayed in control
- Today, the price gapped below the 200 hour MA (at 7303.68 currently). That line was tested and the price moved lower.
The price has also moved below the 38.2% at 7252.749. That level and the 200 hour MA are now key levels on the topside (risk for shorts)
The technicals are taking a bearish walk.
What next?
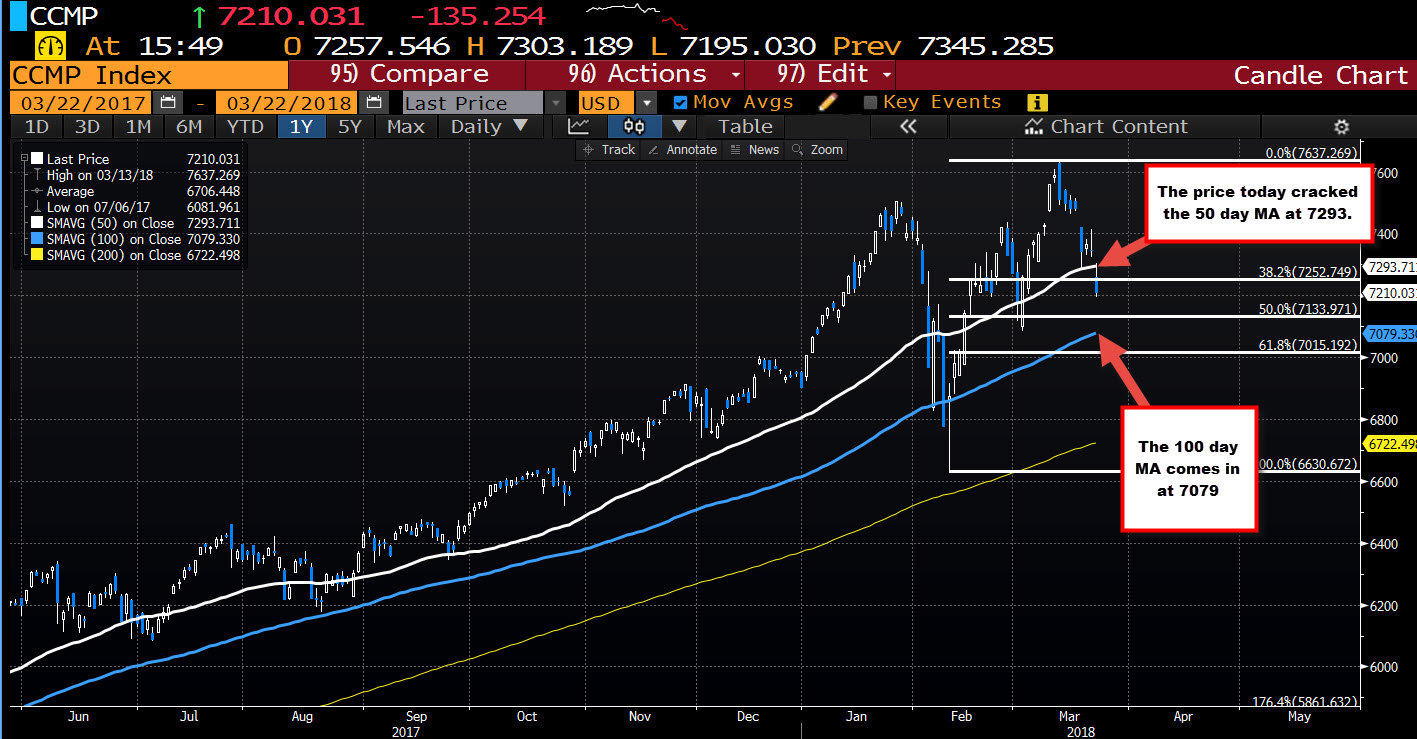
Well if the bears keep the price below the 38.2% and the 200 hour MA, the next target on the downside will move toward the 50% retracement at 7133.97. Below that is the March low at 7084 (see chart below).
Looking at the daily chart below, the 100 day MA comes in at 7079.33. That too is a bearish target on a continuation of the bearish walk in the Nasdaq.