
Tumbles to 50% support. Traders now trading...
The USDJPY continued the surge higher and looking at the daily chart, the pair stalled in a target area. What was that "area".

If you go back to February and March, there were a series of swing lows. The first two (red circle 1 and 2) were near identical. The March low (red circle 3) went lower. The price should have gone lower, but it did not. There was a rebound. Those lows helped to define a future technical "area" for traders to use.
In April and again in May, that area was "in play". In April, the price moved above (bullish), tested (at red circle 5), then failed and tumbled. In May there was a test at 6 and a failed break that stalled at a trend line. OK. Does it all make sense? It does to me. I see action around that area.
Fast forward to today....5 plus months later. The market is climbing. Trader's are probing for the next area. Yes there is the 111.00 level, but there also is that area from the past. Traders can lean - with risk defined and risk limited - and they do (the high reaches 110.92).
The point is....markets and traders, find reasons to pause, to take profit, to maybe add new positions. We don't know if that is it. No one knows, but it stalled and the price is back lower....
What now?
Well, traders know the top risk level. Where is the lower target?
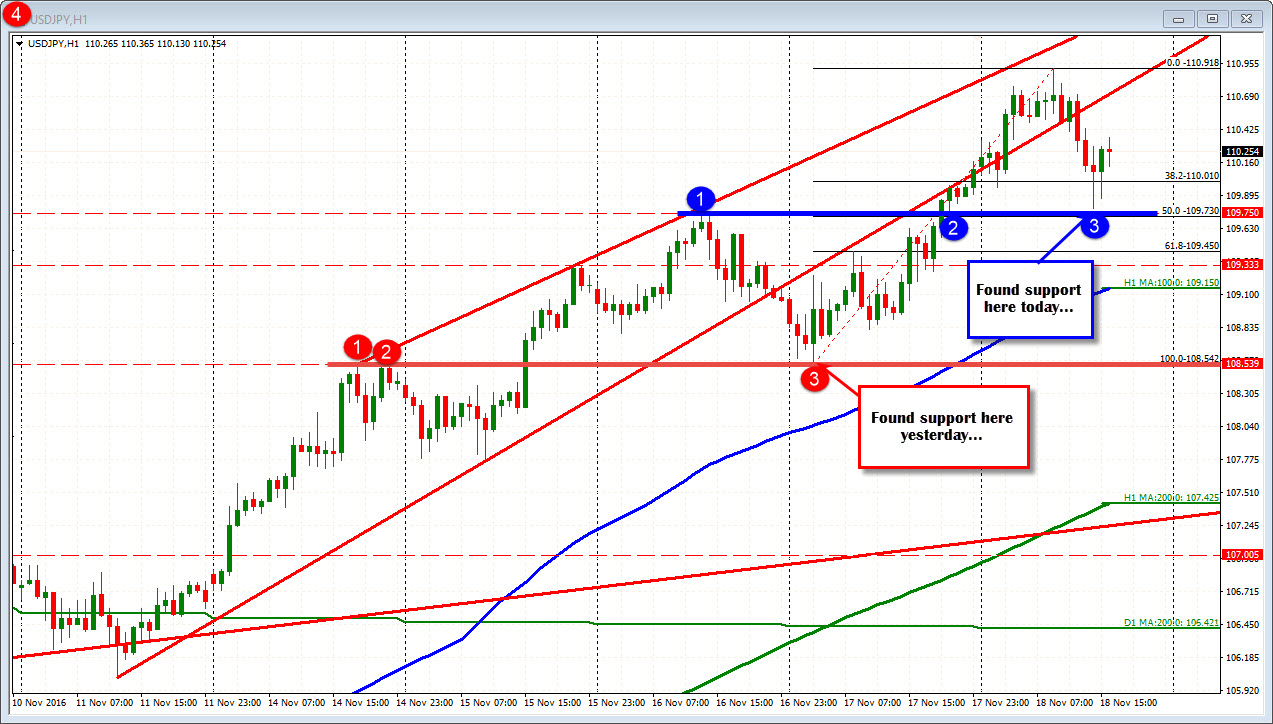
Looking at the hourly chart, the pair bottomed yesterday at the high from Monday. The move up from that point (at 108.54) has the midpoint 50% retracement at the 109.73. Move over to the Wednesday high, and those two levels are near the same.
So if traders lean above, they lean below as well. They stuck their toes in the water against that level.
All that defines the high. It defines a low. Which way do you like?
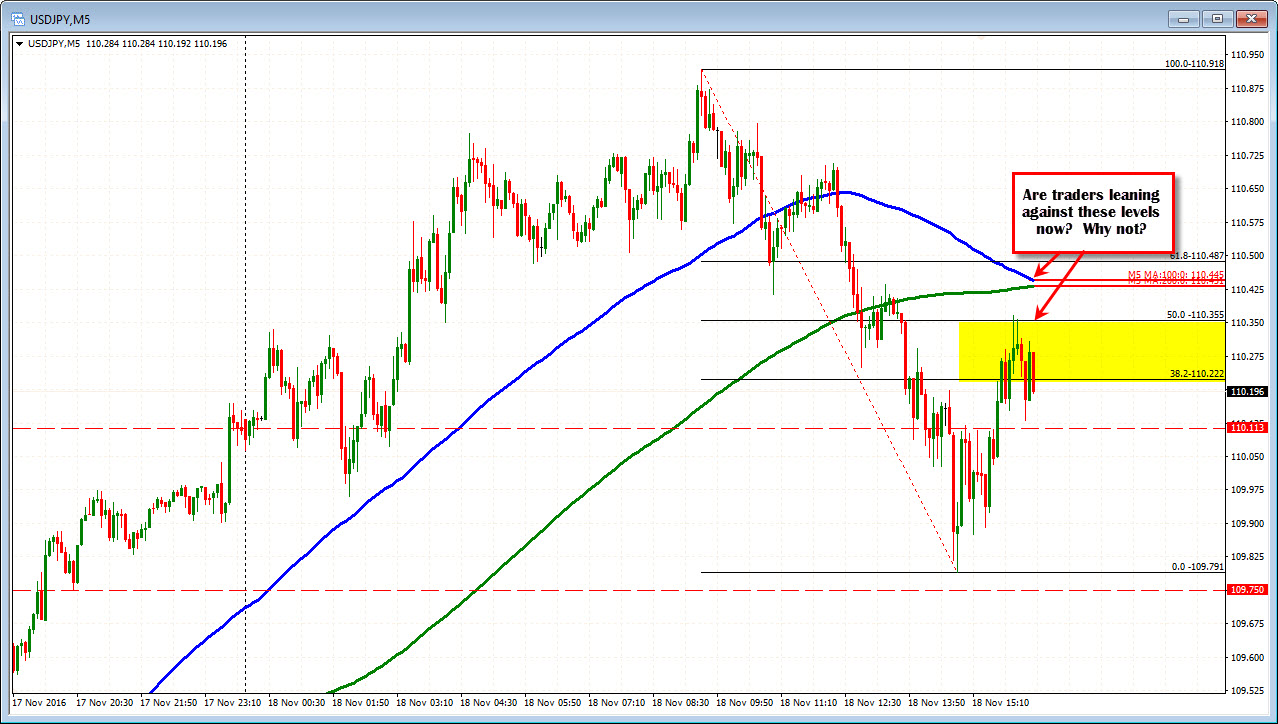
Looking at the 5- minute chart (drilling further),, the correction has stalled at the 50% and below the 100 and 200 bar MAs. Is that the new ceiling? It is Friday. We don't know but what we know is traders can lean.....
The USDJPY charts show a progression today from the daily, to the hourly to the 5-minute. We as traders have the opportunity to follow the progression, put our toe in the water where risk can be defined and limited. If it works, You could be selling the high and buying the corrective low and exiting for the day. If you missed the trade, that is ok. There will be another trade. We can do that too, by what we see and where we have been (some tools also help of course).

