
More upside after yesterday's run up
Yesterday, the EURCAD was the strongest pair. When I looked at it from a trading perspective, there were some technical reasons for the move (see education post from yesterday). There were also some reasons to expect a continuation including:
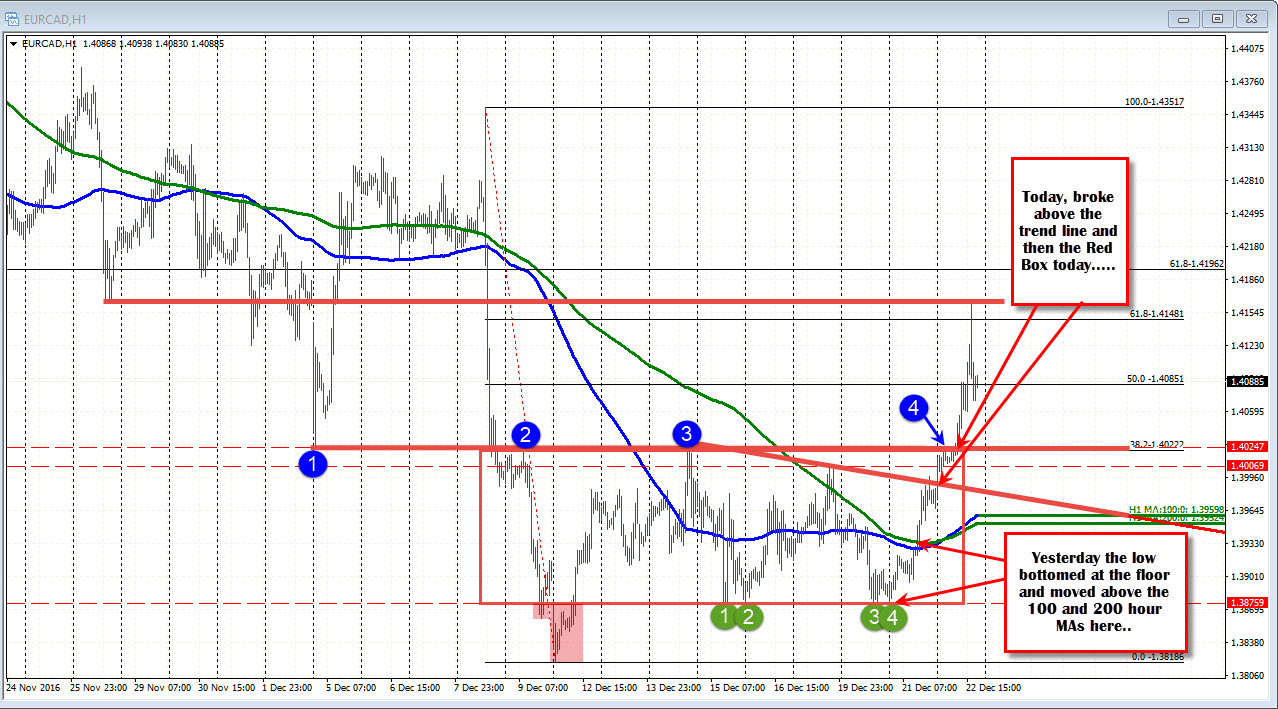
- A strong floor at the 1.3835 area
- A break above converged 100 and 200 hour MA
- Nine days of non-trending played into the chance. Non trending transitions to trending.
There was some hurdles. Trend line resistance stalled the more yesterday. Also the 1.4022 level where the 38.2% and the highs in the "Red Box" were upside hurdles that could get in the way. However, if broken, that could lead to further upside momentum.
So what happened? Looking at the hourly chart above, the price did consolidate below the topside trend line but then broke early in the new day. The move higher stalled for most of the Asian Pacific session. but gains were maintained and when that Red Box was broken, the buying momentum continued.
That momentum took the price to the 50% at 1.4085 and then through that level on the way to a high of 1.4167. The price has corrected off of that peak.
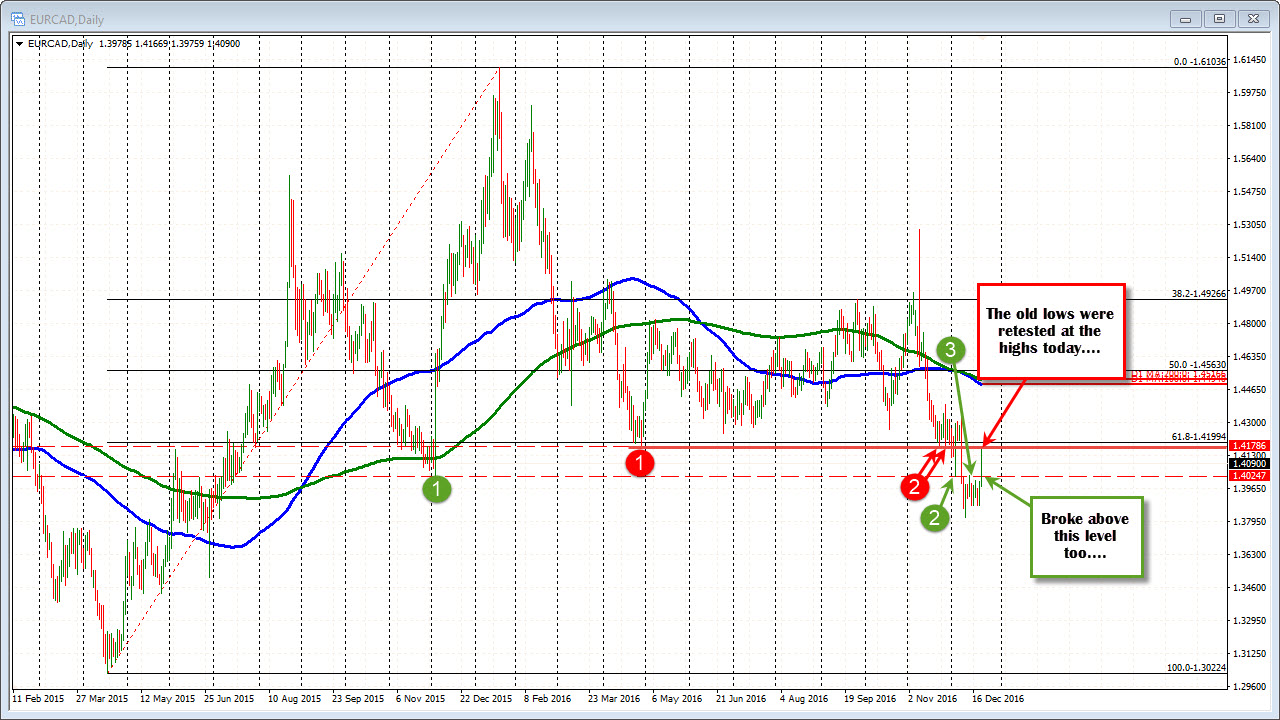
Why did the EURCAD stall at the 1.4167 level?
Looking at the daily chart, the April 2016 low stalled at 1.4180. The lows at the end of November stalled at 1.4184 and 1.4165. Are traders looking at that area as the next topside hurdle to get to and through. It looks like it has had an impact in trading today.
The run up yesterday was the start. There were reasons for the move higher.
The run up today was the continuation of that move higher. The move today stalled near a key resistance target. Traders could see it. Traders could lean against the level with little risk. It was a take profit area. And traders used it to take profit on the trade.
Now what from here?
The price has had a fairly meaningful correction to the 50% of the last move higher (see chart below). The pair is also trading above and below the 100 bar MA. The 1.4066 level will be eyed as an area to find support. The 200 bar MA on the 5 minute chart is moving toward that level.
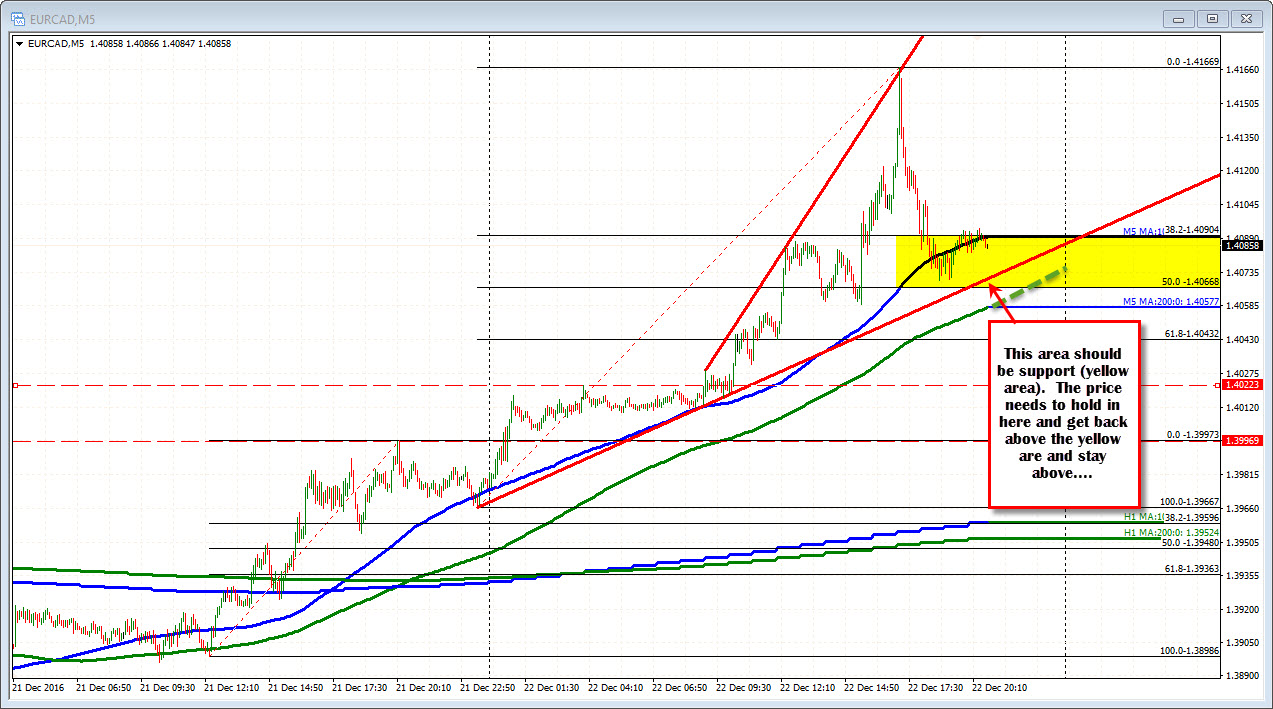
Yesterday, the price action gave some clues. Today there was follow through. Now the going get's a little more tricky after the correction, but we can only see, if the new support holds.

