With headline risk high/liquidity conditions suspect, laps can be a problem to your trading
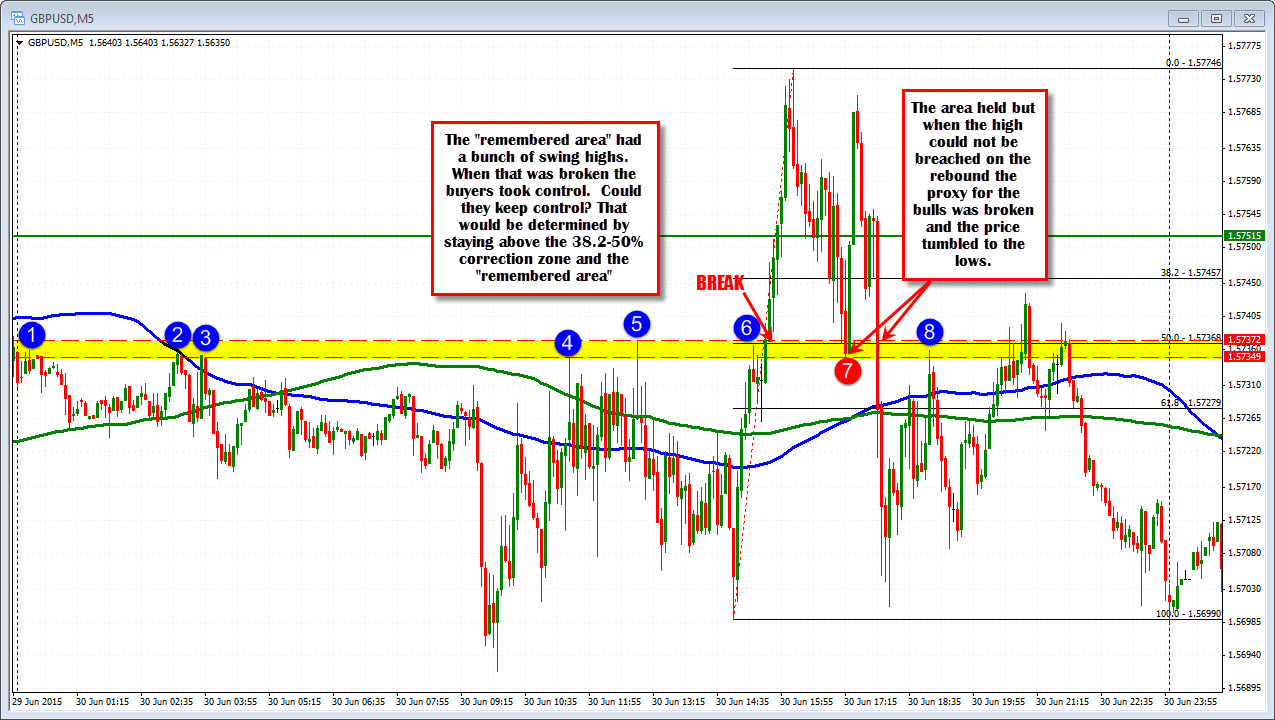
Yesterday, the GBPUSD marched from 1.5699 to 1.5774 in a span of an hour and 15 minutes (see chart below). It was a straight line up for the most part with little in the way of corrections. Trend move right? That is the way I look at it.
When this happens, I expect a correction, but I also expect dip buyers and the potential for further upside potential. What I do not expect is the price moving all the way back down from whence it came. However, that is what ultimately happened.
So how do you protect yourself as a retail trader.
One way is to realize the markets are subject to volatile swings. Some suggest, you just wait out "the noise". For me, the noise is there for a reason. Let's face it, the markets are often volatile because it is unsure of some event or outcome. Eventually that picture will clear up depending on what may or may not happen. That can be a turning point for a currency and if you zig when the outcome is a zag, your trade is really a gamble, not a trade. Greece news this weekend sent the EURUSD gapping lower by 200 pips. The price rebounded 300+ pips after that. That can be quite painful.
What I look to do is to find some technical proxy which will help tell me that the "trend move" (higher or lower) is not all that well supported.

Looking at the 5 minute chart of the GBPUSD above, what do you notice before the sharp move higher? I notice a bunch of swing highs between 1.5734-37. I can count 6 of them before the market price broke higher. That area becomes a "remembered area" for me. I expect the market to remember that same area when and if the level is tested. I expect it to hold support. Why? Because traders can define risk, and limit risk against that level.
The price of the GBPUSD broke above that line and the sentiment switches from more bearish to more bullish. Over the next 7 bars it is a steady trend continuation higher in the pair. All good things come to an end, and that is true for surges higher and lower, but I do expect the party to remain going in the direction of the trend. After all, the market loved the GBPUSD on the way higher. Buyers were taking control. They should love it on corrections too, but traders still need to protect. It is the surprises that cause the most pain. Just ask those who sold the EURUSD on Monday, only to have the price surge higher.
So what I like to do is to test the buyers willingness to keep control and the sellers ability to take back control. How is that done? By applying a Fibonacci retracement. If the price stays above the 38.2-50% "correction zone", I conclude the buyers are keeping control. In the chart the 50% comes in at 1.57368. This is right near the "remembered area" at 1.5734-37. That is good news for the buyers. If the price stays above correction zone and the remembered area, all is still bulllish. If it goes below all is not right. Buyers are now protected. In choppy markets it is important you have protection as sentiment can change - it does not have to, but it can.
The GBPUSD price goes down and stalls right at the low of the remembered area (red circle 7). Buyers enter. It went right to the abyss and held. Two bars later the price was back near the highs. Could the price break higher? No. That is a worry. That worry is confirmed by the move through the support area and the price rotates all the back toward the area where the rally began. A full lap was just about completed and the market chopped up and down from there with more of a bearish bias (it is down another 100 or so pips today). The bias for the pair turned completely around on the break of the 50% and that remembered area....
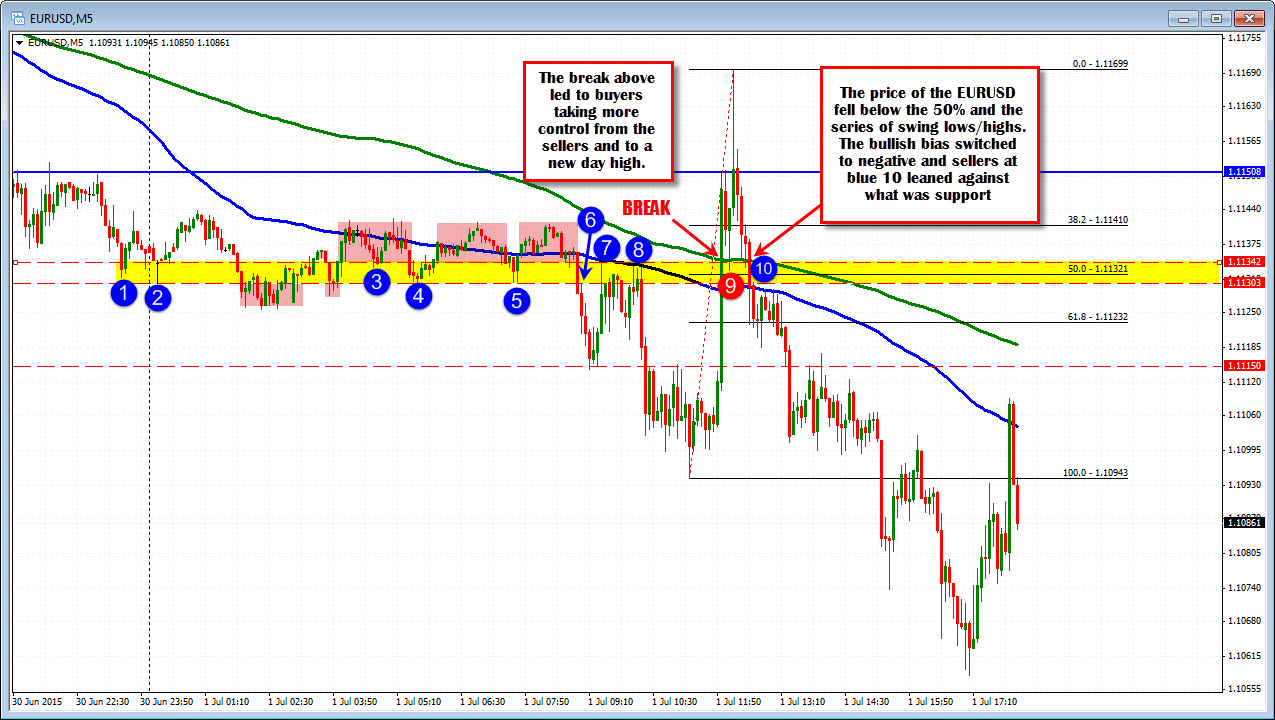
Looking at the 5 minute chart of the EURUSD today (see below), the price in the Asian session meandered up and down(see blue circles). There was an area between 1.1130-34 where there were a number of swing lows/highs. As London traders entered, there was a move to the downside, followed by sharp move back higher. As the market surged, the EURUSD price moved above the remembered area (yellow area in the chart below). After breaking above this level, the price corrected down and tested the area at the red circle 9 before surging to new day highs.
Applying a Fibonacci retracement to the trend move higher just like I did on the GBPUSD example above, the 50% retracement came right in the yellow area, defined by the various swing highs and lows for the day. As long as a price stayed above that area, the Bulls were in control. Once the price fell below, however, that was enough for me and the market as well to change that bias. The sellers took back control and forced the price down.
In markets where the possibility exists for choppy action, it is important that traders stay flexible and look to define areas where the technical bias can quickly switch from bullish to bearish or from bearish to bullish. Doing so will allow traders to limit risk and protect valuable account balances. It is hoped that the key areas may also provide trading opportunities that give profit potential. Finally, they should also provide lessen trader fear in a time where fear and anxiety is great.