
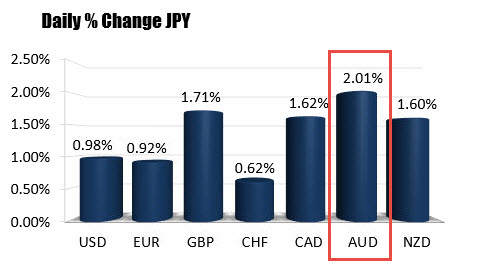
The weakest pair for the day for April 5th 2016 is the AUDJPY
The weakest currency pair of the day shows the AUDJPY as the weakest.
Earlier the RBA did say about the Australian dollar:
"The Australian dollar has appreciated somewhat recently. In part, this reflects an increase in commodity prices, but monetary developments elsewhere in the world have also played a role. Under present circumstances, and appreciation exchange rate could complicate the adjustment under way in the economy"
That and some stock weakness has pressured AUDJPY.
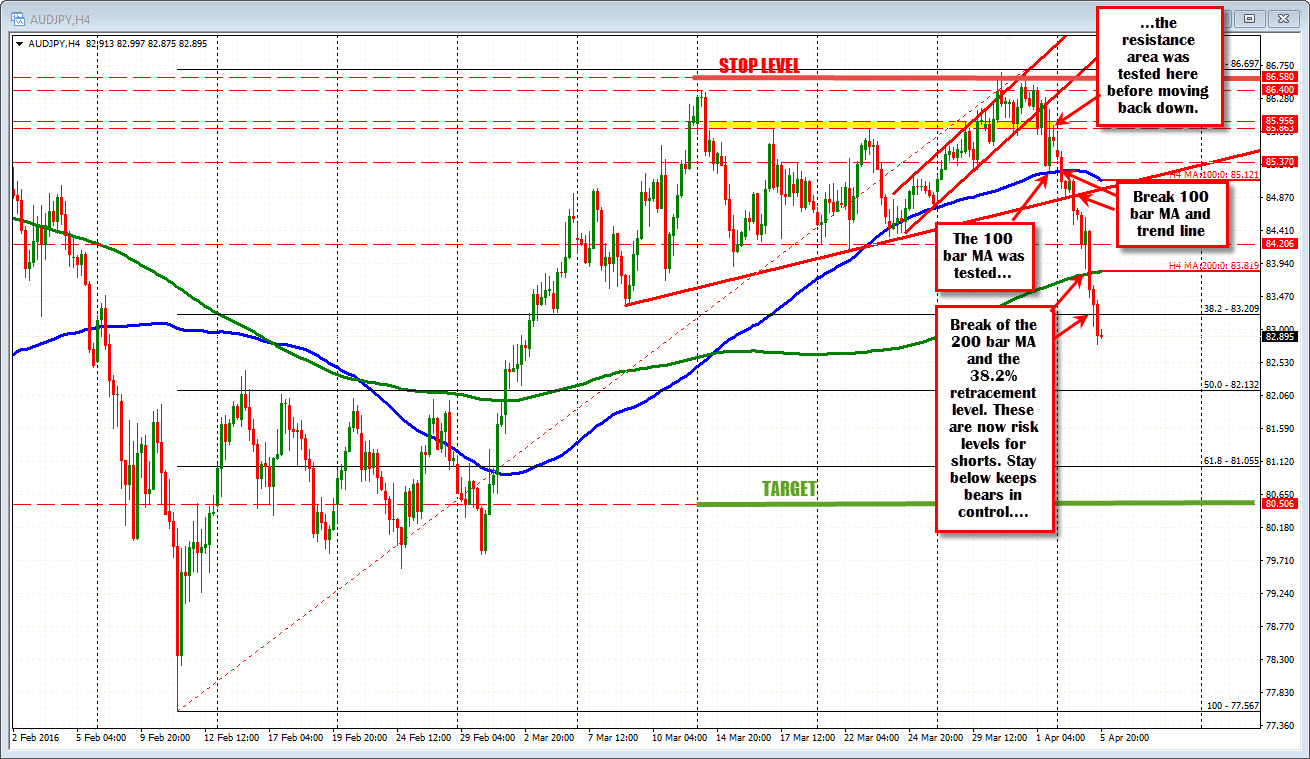
If you recall from last week, Adam posted about a trader recommendation from HSBC citing the RBA's concern about a higher currency, and the potential for increased risk aversion. Their fundamental reasons proved to be right. That is the good news. The bad news is their trade recommendation was stopped out (see chart above). Pouring salt in the wounds, the stop was at 86.58. The high price stalled at 86.697 - just 11 or so pips from their stop level (who has had that happen to them?) . You can review that post and my follow up by CLICKING HERE.
The trades target has yet to be reached. However, the 2% decline today has gotten the pair closer to the 80.50 target.
So what does the technicals look like for the AUDJPY pair? Also, was there other chances to get back on the trade?
Looking at the 4-hour chart above, the 85.86-95 area was a resistance level by virtue of a double top from March 17 and March 23rd. That area was broken on the way to the highs last week, and that break led to the push to the stop level on March 30th and again on March 31st (just for good measure).
On Friday, however, that level was broken to the downside and the downward momentum was started.
The first stop was a test of the 100 bar MA on the 4-hour chart (see blue line in chart above). After bouncing off that MA, the price went up and tested the yellow area one last time (the double top). The holding against the old double top on that correction was bearish clues the sellers needed. They sold....
The breaking of the 100 bar MA yesterday pushed the bias further into the bearish camp, as did the break of the trend line connecting lows going back to March 9th. Another bearish confirmation.
Today, the 200 bar MA was broken (green MA line) - adding to the bearish momentum The 38.2% was also broken at 83.209.
There is still a ways to go, but the trade is on it's way. Close risk comes against the broken 38.2%. A mover conservative risk defining level for a move to the 80.50 target would be the 200 bar MA on the 4-hour chart at the 83.819 level currently. Stay below and the bears remain in firm control.
Sometimes the reasons for your trade will all be there, but the technical picture is not right. Other times, the market may stop you out. Does it mean you have to give up on the trade? No, there may be other opportunities to take advantage of the idea but with the technicals supporting the trade too.

