No matter what the ECB and BOE said this week, the bond bear market is still dominating my thoughts. I do not believe that in the UK at least, we are Turning Japanese, with deflation and zero interest rates forever. Like chocolate whilst on a diet, inflation is too much of a temptation for our austerity imposing political class.
With inflation will come eventually, higher rates – there will be an end to ultra-cheap cash. So I have decided this week to talk bond mathematics (please don’t stop reading now). In particular I want to explain the way that bond prices behave and that is called convexity.
I am very lucky in that Ioan Smithhas bought me a t-shirt:
I can’t wait for my t-shirt to be delivered (although mine is apparently in pink).
My column last week was about rate tightening in both European and UK money markets. I’d like to think both Mario Draghi at the ECB and Mark Carney at the Bank of England had been reading my thoughts (albeit unlikely). However clearly the money market moves contributed to their decisions to use “forward guidance” of low rates for years. The effect of these statements reversed the implied tightening in the markets as you would expect.
Carney’s guidance in particular came as a surprise – it was only his fourth day on the job. However he is a political animal and an ex-Goldman investment banker. He has come here to make his reputation and will want to outshine, outwork and outthink all else. My view on his move this week? My tweet:
So we now know the Carney-Osborne deal. No rate rise until after election no matter what economy does.
I think he is economically dangerous long term but the Conservative party want him to engineer a booming economy to get them re-elected in 2015 (without forcing them again into a Liberal Democrat coalition). The question is whether he can dominate the Monetary Policy Committee to ignore stronger economic date and high inflation to keep rates low. He has but one vote – can he persuade the rest to his way of thinking? His forward guidance statement on day four suggests he intends to dominate the MPC and has already had some success in doing so.
However what is interesting is that the bond markets barely reacted at the long end. Initially they rallied but on the day, ten-year bunds and gilts were barely moved. Why? I think because bond markets already fear “The Big Exit”, when it becomes apparent that rates are beginning the path to normalisation.
And this fear, of the great bond bear market, has begun. This week we learnt that PIMCO’s flagship bond fund had seen almost $10bn of redemptions in just the month of June – the largest outflow of money in its history. Boss, Bill Gross, of course sees no end in sight to the great 30 year bull market in bonds but then he has built his reputation, career, and vast wealth on it.
Whenever the media want an explanation of the bond markets and what is going on, they find a bond fund manager who always will talk positively. So let me tell you the story they don’t tell – the tale of convexity.
So as we know, bond prices fall when interest rates rise. That is because the value of a 2% coupon bond for example will be much less if rates increase to 4% – the new bonds are issued paying twice the interest, so the old bonds must be worth less. However the relationship between bond price and yield is not linear. It is, in fact, for a simple bond, convex:
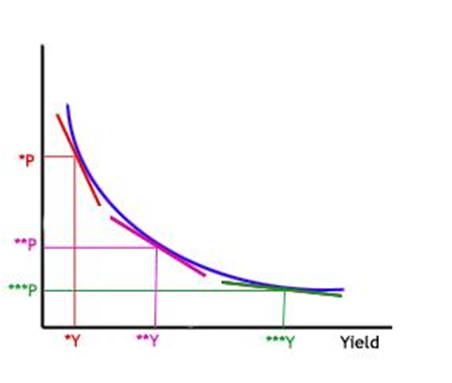
So this chart shows the bond price on the y or vertical axis and the Yield (or interest rate) on the x or horizontal axis. As you can see as yields / rates increase (from left to right) the bond price falls (from top of graph to bottom) – the relationship is inverse. But what can be seen is that the relationship is not a straight line. It is convex.
The gradient of the line shows how much a bond’s price will move given a certain change in interest rates. This is called Bond Duration. But Duration (or the gradient) is not a constant – it varies – the line is convex and not linear. The lower the interest rate, the greater the bond price move (for a given change in rates). This can be seen easily on the chart. The red straight line is the bond’s duration for a low interest rate – it is a very steep line showing that bond price will move a long way for a given change in rate. The green line is much shallower showing that the bond’s price is much less sensitive to a rate change when rates are already high.
The steep red line shows why Mr Gross and his bond buddies have loved Central Bank actions following the crisis. However, the higher the high, the further to fall. And the high has been extreme thanks to record low interest rates and QE. Convexity is great when rates are being cut, but awfully painful when rates rise.
I wonder how many of retail investors (or even their advisers) understand this? As equity markets have struggled to return to their 1999/2000 highs, bond funds have become exceedingly popular. From the UK’s Investment Management Association Statistics In May, June, July of 2012, corporate bond funds were still the top selling retail funds. Trillions have been piled into specialist fixed income funds. The pain of convexity (rather than the pleasure) is a lesson that will be learnt, the hard way (even if not the easy).

