
Moves back toward day's lows. Low to high trading range only 35 pips as traders await the FOMC decision/presser
The EURUSD moved higher in Asian trading after the low yesterday stalled near the now 18 day 50% midpoint and near the 200 hour MA (green line in the chart below). Having said that, the rally was limited (low to high trading range is only 35 pips), a topside trend line found sellers near the line, and the price just dipped back below the 1.2000 level and trades +/- the close from yesterday at 119.94 (the low just reached 1.1989.
Overall, the price has been in a somewhat wide but real 1.1823 to 1.20969 range going back to August 25. The range for the month of September is 4th lowest trading range going back to December 2014. The pair has had it's share of ups and downs, but is not going too far.
Do we make a break for an extreme on the FOMC decision? Do we break out of the range that has confined the range? What will be the steps?
Technically, the price is above levels that give it more of bullish bias. That can change. What would change the bias?
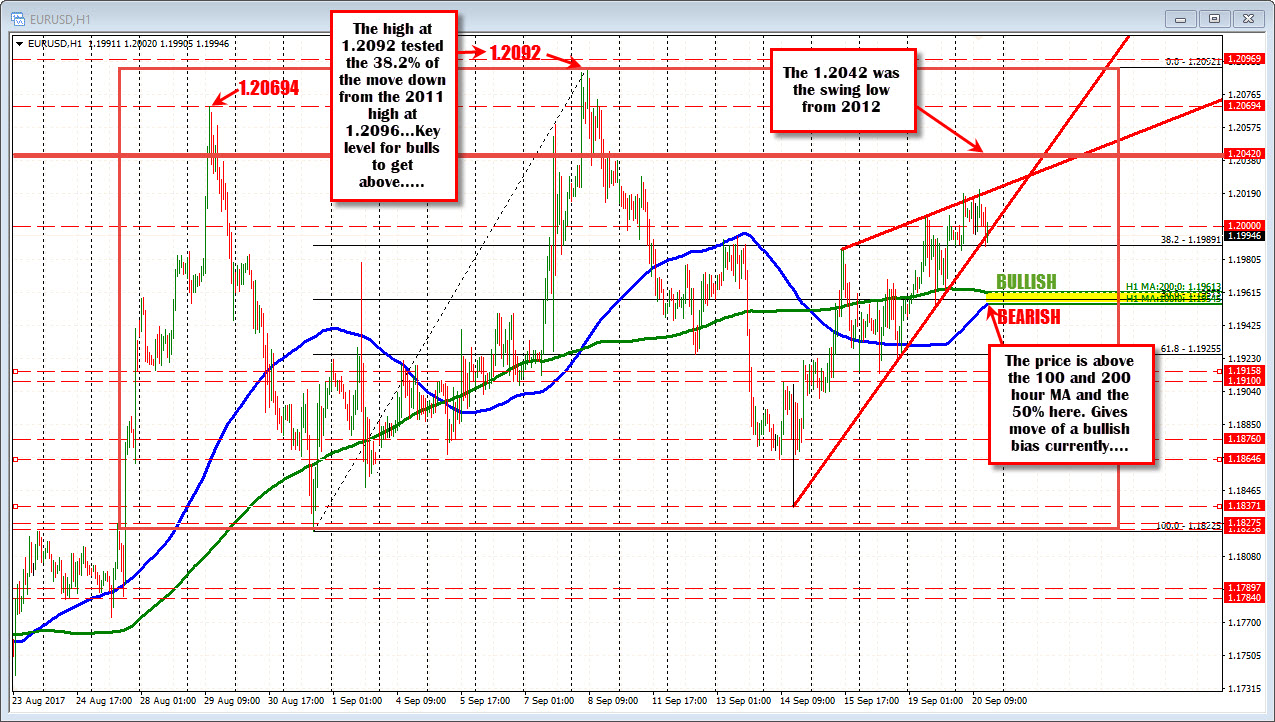
Looking at the hourly chart above, the bullish bias comes from being above the 100 and 200 hour MAs and the 50% retracement level.
- The 200 hour MA (green line in the chart below) is at 1.19613
- The 50% retracement is at 1.19573
- The 100 hour MA is at 1.19546
That area between 1.19546 and 1.19613 give the bullish bias technically. A move below that cluster of support (and stay below) would turn the bias around today. It is risk for longs.
Move below and the market will focus on
- 1.1910-158. The 1.1910 was the swing high going back to early August and the lows for the week stalled just ahead of that level at 1.1915.
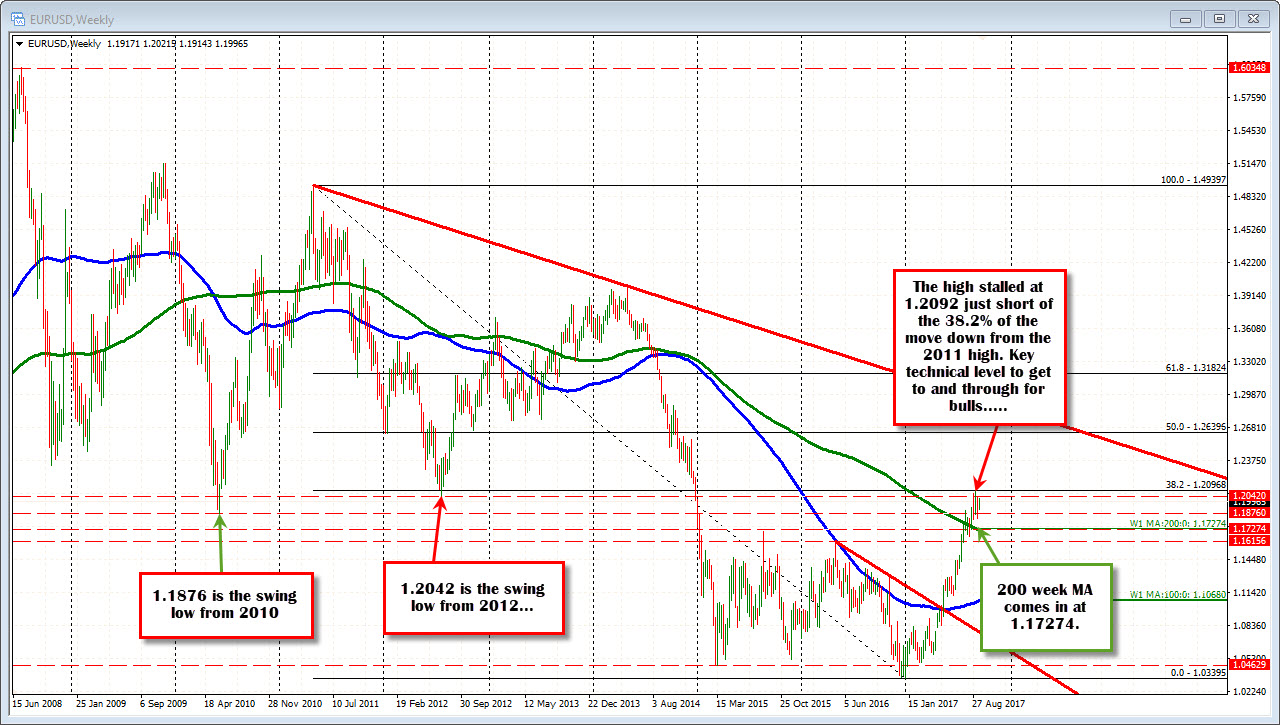
- 1.1876. That level was a swing low from 2010. A swing low form Sept 14 stalled at 1.1864 (see weekly below)
- 1.1837. Swing low from last week and the low for the month of September.
- 1.18225. Low from August 30.
- 1.1727. 200 week MA this week (see weekly chart)
On the topside on a more dovish Fed:
- 1.2021: High for the day
- 1.2042. This was the swing low from 20122
- 1.2069. Swing high from August 29
- 1.2092-96. The high from September 8th is also the highest level since the end of December 2014. The 1.2096 is the 38.2% of the move down form the 2011 high. Key level for a continuation of a bull run.

